We’ve just closed out on the European session and it’s time to put together the second of our twice daily analyses in the bitcoin price. This morning’s analysis was pretty simple – we wanted to see a continuation of the upside run with, ideally, a clean break through the $10,000 mark and – subsequently – a holding of said level as support.
We didn’t get quite what we were looking for.
Price is currently correcting pretty substantially and there’s a good chance we’re going to see further downside action as the substantial portion of the US session gets underway.
So, let’s jump straight into things and try and get some levels in place that we can use to draw a profit from the market as and when things move. As ever, take a quick look at the chart below before we get started so as to get an idea where things stand from a bitcoin price perspective.
The chart is a one-minute candlestick chart and it’s got our key range overlaid in green.
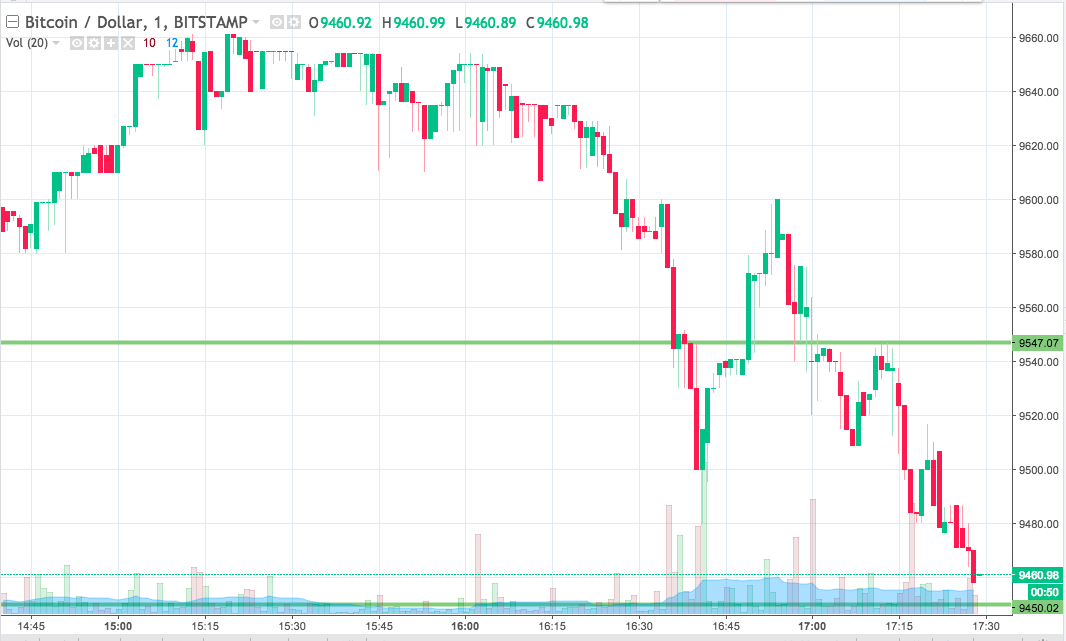

As the chart shows, the range we are looking at for the session today comes in as defined by support to the downside at 9450 and resistance to the upside at 9547.
We are going to stick with our standard breakout approach for the time being, so we’ll look at jumping in long if we get a close above resistance towards an immediate upside target of 9600. A stop loss on the trade somewhere in the region of 9535 looks good in terms of risk mitigation.
Looking to the short side, if we get a close below support, we’ll jump in short towards an immediate downside target of 9400. Again we need to put a stop loss on the trade and somewhere around 9460 looks good.
Let’s see how things play out.
Charts courtesy of Trading View