So that’s another day done for our bitcoin price trading efforts and – yet again – we’ve seen an incredible amount of volatility hit the charts as price has matured towards the daily close. We’re seeing an awful lot of this sort of action of late – breakout, run, consolidation type stuff – and this has made for some pretty great trading conditions so far this week. We’re now heading into the close of the European session and we’ve got the US late afternoon (as well as the Europe-US crossover) right ahead of us. What we would love to see is some more of the sort of action outlined above.
This will allow us to enter the latter half of the week in a real strong position and should make closing out the week for a net gain relatively simple.
So, with this in mind, let’s get some levels outlined that we can use to take advantage of price action id we see the type of movement we are looking for. As ever, take a quick look at the chart below before we get started so as to get an idea where things stand and where we are looking to jump in and out of the markets if and when things move.
The chart is a one-minute candlestick chart and it’s got our range overlaid in green.
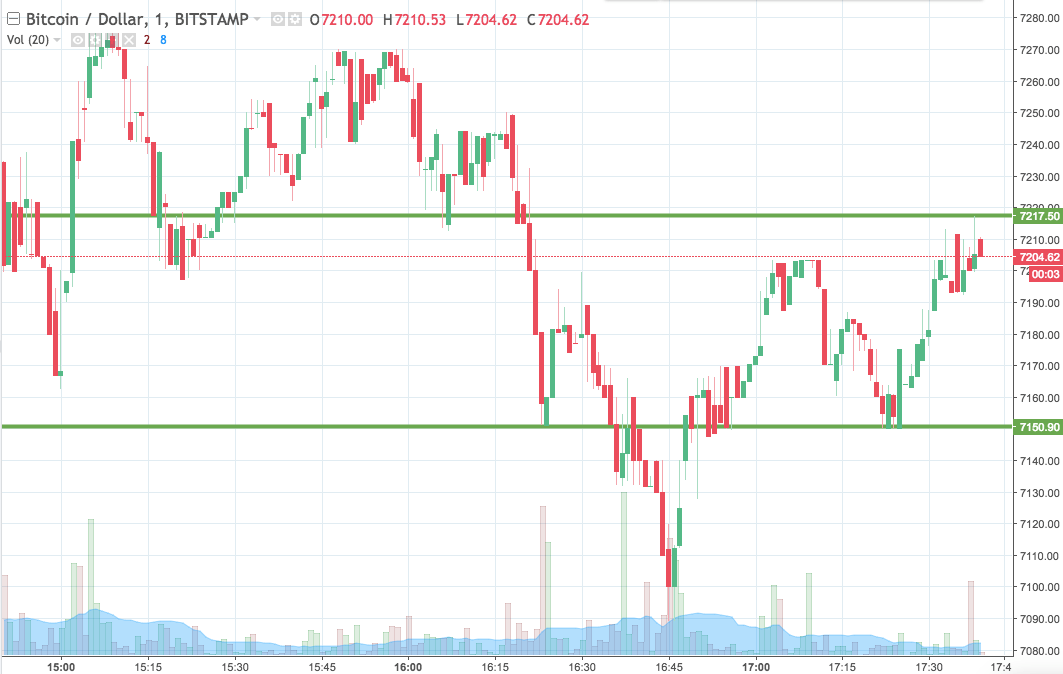

As the chart shows, the range we are looking at for the session this evening comes in as defined by support to the downside at 7150 and resistance to the upside at 7217. We are going to look at jumping in long on a close above resistance, with an initial upside take profit target placed at 7265. Conversely, if we get a close below support, we’ll jump in short towards a downside target of 7080.
Let’s see what happens.
Charts courtesy of Trading View