When we first saw the bitcoin price break 4000, general consensus was that 5000 would be just around the corner. This isn’t an unreasonable assumption – bitcoin has, after all, risen from less than 1000 to current levels year to date and has been breaking through psychologically key resistance levels along the way relatively easily. 5000, however, seems to be proving tougher. The bitcoin price has consolidated in and around the 4500 mark for a while and just can’t seem to pick up that breakout that carries it up and beyond the big five. With that said, however, it can only be a matter of time. Market forces are very much leaning toward strength right now and when 5000 comes, it will come quickly.
Our approach means that we have the 5000 key level constantly in the back of our minds, but we are also interested in a number of smaller, more achievable levels between now and then. This allows us to jump in and out of the markets on any intraday volatility while also taking advantage of an overarching trend. So, as we head into the session today on Tuesday, let’s get some levels outlined with which we can try and take advantage of just the sort of move we are talking about. As ever, take a quick look at the chart below before we get started to get an idea of what is on where things stand. It is a one-minute candlestick chart and it has our key range overlaid in red.
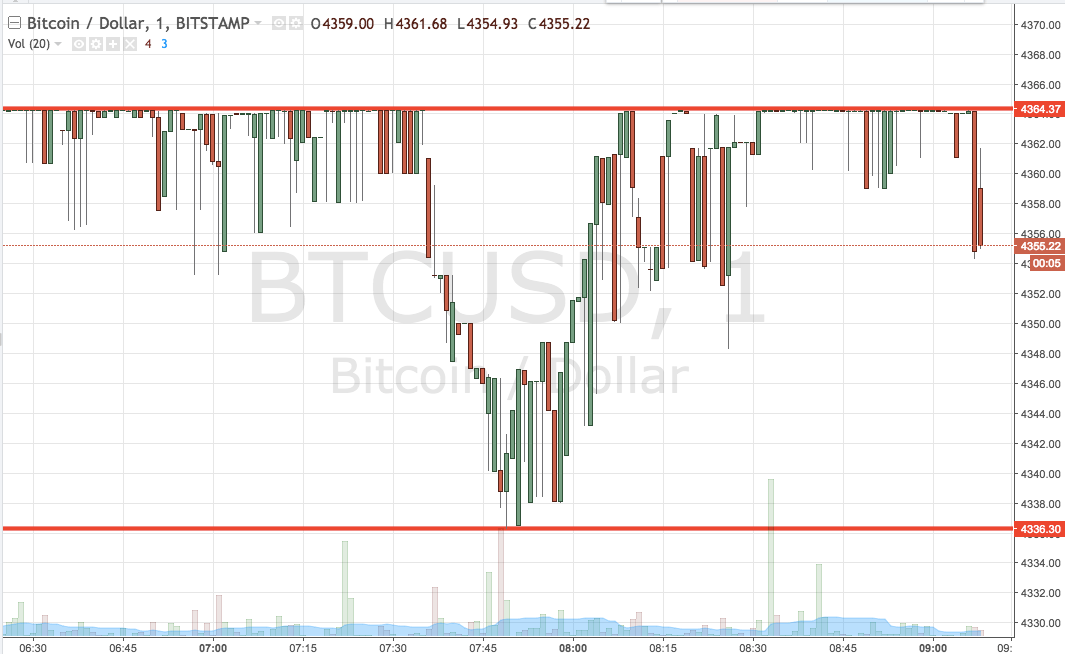

As the chart shows, the range we are looking at for the session today is defined by support to the downside at 4336 and resistance to the upside at 4364. We will look for a close below support to validate a downside entry towards 4300 flat. Conversely, a close above resistance will have us in long towards 4400 flat.
Charts courtesy of Trading View