

Throughout much of 2019, Bitcoin’s store of value narrative took a back seat to a new narrative developing around looming economic recession and the asset’s scarcity making it a safe haven asset much like gold.
Bitcoin has had many comparisons to the precious metal, and is considered to be its digital counterpart. But Bitcoin also appears to be following a fractal on gold charts – one that would have predicted the recent drop from a triangle chart pattern – and could help provide clues as to what happens to the market next.
BTC Continues to Follow Gold Fractal
There’s no denying that Bitcoin stole some of gold’s limelight this year as the two, scarce, financial assets began to rise and embark on a new bull run this year in the face of an impending global recession.
Related Reading | Bitcoin Could Follow Gold Fractal With 44% Drop to Under $7,000
The two assets appeared to be highly correlated, rising and falling in tandem. It helped fuel that Bitcoin as a safe haven asset narrative, alongside gold, and forex currencies like the Japanese yen or Swiss franc – all known to hold their value even when the rest of the financial world is in turmoil.
https://twitter.com/traderx0x0/status/1177214848192696322?s=21
The correlation has ended with Bitcoin’s latest break below support at $10,000, where Bitcoin plummeted 20% in the matter of a week. And while the correlation has ended, Bitcoin may still be following the precious metal in some way.
According to one crypto analyst, a fractal on gold price charts from 2011 matches the price action within Bitcoin’s recent triangle chart pattern formation. Like the crypto asset, gold also broke down from the formation, resulting in an extended reaccumulation and consideration phase that it is only now ending as the precious metal embarks on a new bull run.
Max Pain: Bitcoin Could Trade Sideways in $5,000 For Next Two Years
By superimposing the price action following gold’s fractal breakdown over Bitcoin price charts, it could provide clues as to what might happen next in crypto markets.
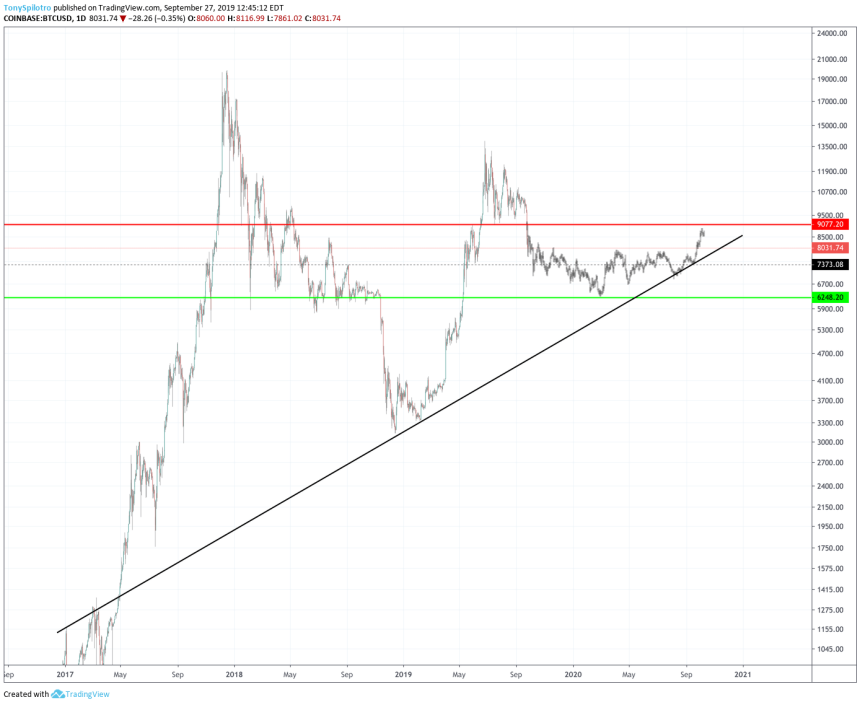

If the crypto asset follows the fractal perfectly as it has so far, it suggests that Bitcoin price will be trading between where the triangle breakdown occurred – around $9,200 – and where the April rally broke out from the bear market bottom ascending triangle formation at around $4,200.
Worse yet, Bitcoin could be stuck in this trading range the entirety of 2020 and into 2021 before it returns to where gold is currently – right below the former horizontal resistance where the triangle broke down and is struggling to get back above it and continue its bull run.
Related Reading | Analyst: Gold Bull Run to Eat Bitcoin Alive, Takes Entire BTC Cap to Move Price 3%
Crypto traders like to talk about what would be the “max pain” scenario, up, or down, but what might be the most painful of all, is two years being trapped inside a $5,000 trading range between $9, 000 and $4,000 for the next two years.