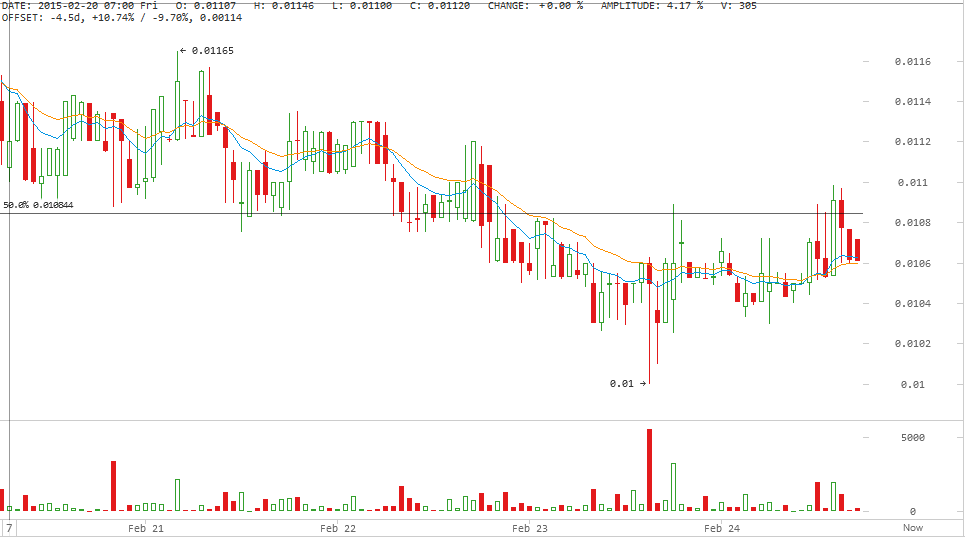
Darkcoin price dropped yesterday to record a low of 0.01 BTC before rising up again to record a high of 0.01099 BTC earlier today. It seems that an increase in price is resisted by the 50% Fibonacci resistance fan level that we plotted during earlier analysis.
By analyzing the 1 hour Cryptsy (DRK/BTC) chart from bitcoinwisdom.com, plotting the 10 hour EMA (green curve) and the 20 hour EMA (orange curve) and calculating the MACD indicator (look at the below chart), we can conclude the following:
- Although the price has been above the 10 hour and 20 hour EMA during most of today’s trading sessions, the previous support level at the 50% Fibonacci resistance fan level is now resisting advancement towards the bullish side.
- The long upward shadows of the candlesticks when the price approaches the 0.010844 BTC level denotes that the market is resisting advance above this level, especially that today’s trading volume is relatively low.
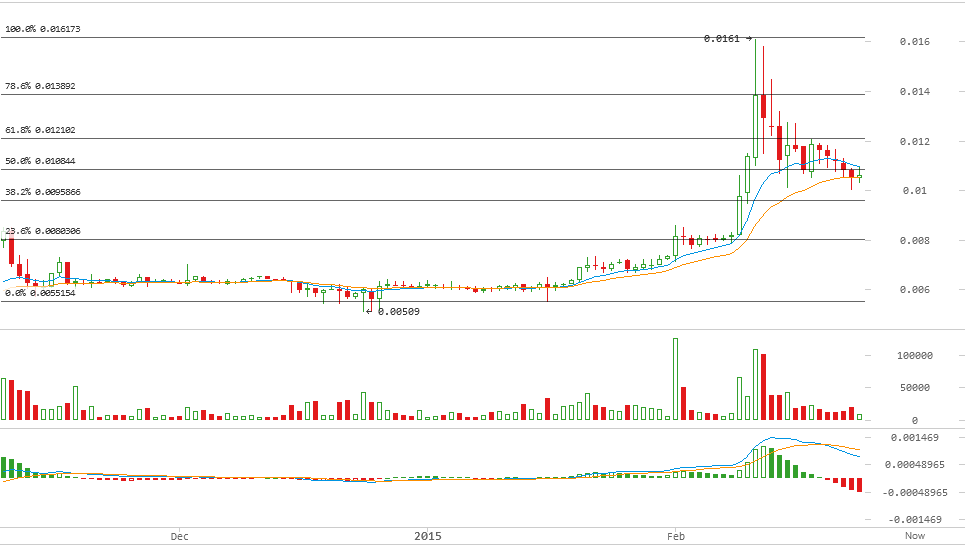
By analyzing the 1 day Cryptsy (DRK/BTC) chart from bitcoinwisdom.com, plotting the 10 day EMA (green curve) and the 20 day EMA (orange curve) and calculating the MACD indicator (look at the below chart), we can conclude the following:
- As the price has already breached the 0.010844 BTC level, it seems that we can witness a further decline during the upcoming couple of days to test the 38.2% Fibonacci resistance fan level at 0.009586 BTC
- Although the value of the MACD indicator is in the positive territory, the red signal line is above the blue MACD line, so we can see the price drop to lower levels soon.
Conclusion:
Darkcoin price has been trading below the 50% Fibonacci retracement fan level during most of yesterday’s and today’s trading sessions. Our technical analysis is in favor of a further decline to test the 38.2% Fibonacci retracement fan level during the upcoming couple of days.
Charts from Cryptsy