Reason to trust

How Our News is Made
Strict editorial policy that focuses on accuracy, relevance, and impartiality
Ad discliamer
Morbi pretium leo et nisl aliquam mollis. Quisque arcu lorem, ultricies quis pellentesque nec, ullamcorper eu odio.
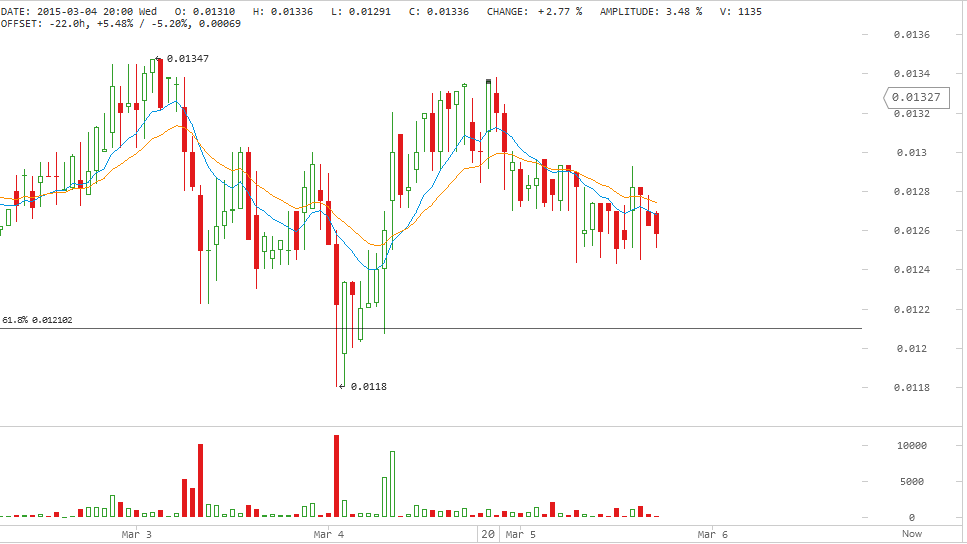
Darkcoin price traded between 0.01240 BTC and 0.01290 BTC throughout most of yesterday’s and today’s earlier trading sessions. It seems that DRK price will remain trading along this range for some time before deciding whether to go to the bullish or bearish side.
By studying the 1 hour Cryptsy (DRK/BTC) chart from bitcoinwisdom.com and plotting the 10 hour EMA (green curve) and the 20 hour EMA (orange curve) (look at the below chart), we can conclude the following:
- Darkcoin price has been going along a rather horizontal trend line throughout the past 16 hours or so, however, the long downwards shadows of the candlesticks on the 1 hour charts may mean that the price prefers to go a bit towards the bullish side.
- As the trading volume has been rather low during the past 24 hours, we are likely to see the price remain within the 0.01240 – 0.01300 BTC range. It is less likely to see the price dip down to fall below the 62% Fibonacci retracement level at 0.012102 BTC during the next 24 hours as it seems to have support well above this level.
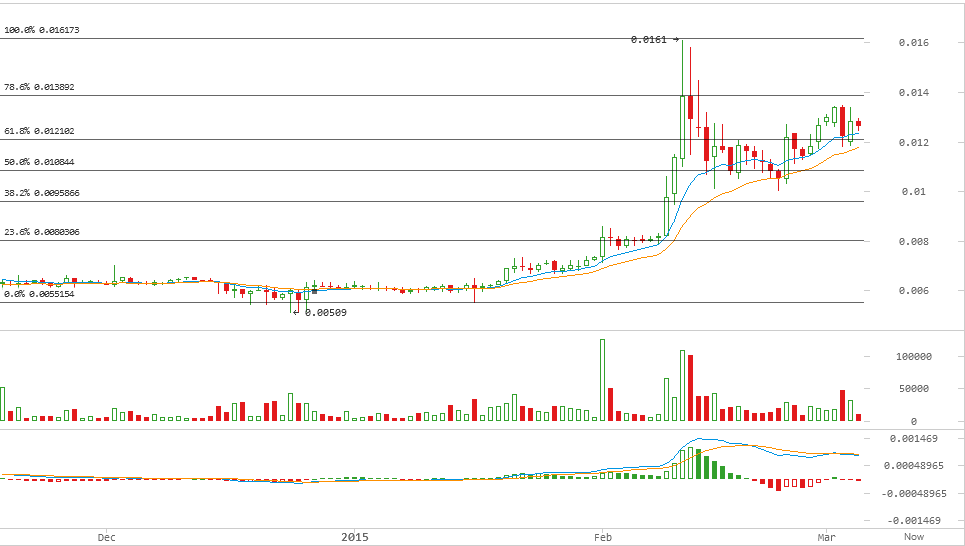
By studying the 1 day Cryptsy (DRK/BTC) chart from bitcoinwisdom.com and plotting the 10 day EMA (green curve) and the 20 day EMA (orange curve) and calculating the MACD indicator (look at the below chart), we can conclude the following:
- DRK price is now above the 10 and 20 day EMAs which reflects a new uptrend that has slowed down a bit throughout yesterday’s trading sessions.
- The MACD indicator’s value has entered the positive territory, yet the red signal line has crossed above the blue MACD line. Whenever the MACD blue line is on top again, we can see the bulls take control of the market again.
Conclusion:
Darkcoin price is oscillating between 0.01240 and 0.01300 BTC and it is likely to remain within this range until the trading volume rises up again.
Charts from Cryptsy


