DarkNote Price Key Highlights
- DarkNote price after a false spike down moved back higher, but struggling to gain strength.
- A major resistance is forming around 0.00000088BTC, which prevented upsides many times.
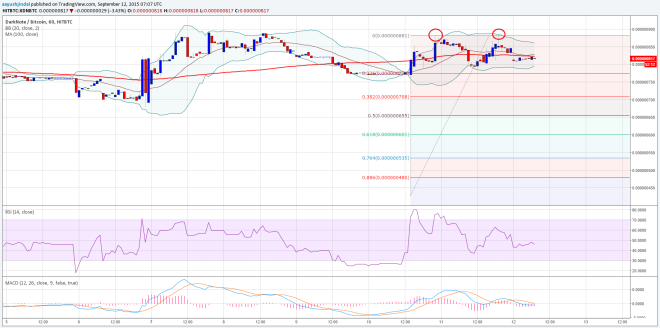
- There is likely a double top pattern formed on the hourly chart, which might push the price lower.
DarkNote price is struggling to clear an important resistance around 0.00000088BTC that might push it down.
What’s next?
We highlighted recently that there was a false break, which pushed the price down by a lot but later it managed to recover ground. The price was above the 100 hourly simple moving average for some time and then later traded below it. There were a couple of attempts to clear a major resistance area around 0.00000088BTC. So, there is a chance of it trading lower and forming a double top pattern. There is a bearish pressure forming on the price since the double top pattern is taking shape.

The price is below the 100 hourly SMA, and likely heading towards the 23.6% Fib retracement level of the last wave from the low of 0.00000042BTC to 0.00000088BTC high. It could be a negative move if the price breaks down and settles below the 23.6% Fib retracement level. There are a few bearish signs visible on the hourly RSI, which might push the price down in the near term if sellers start to come in. The next level of interest below the 23.6% Fib level could be around the 50% Fib level.
On the upside, a break above the last high of 0.00000088BTC might call for more gains moving ahead. The next barrier for buyers in that case could be around 0.00000090BTC.
Intraday Support Level – 0.00000075BTC
Intraday Resistance Level – 0.00000088BTC
The hourly MACD is heading towards the bullish slope, which might encourage buyers.
Charts courtesy of Trading View


