Key Highlights
- Dash continued to struggle, as buyers failed to take prices higher.
- It remains at as major risk of a break lower if sellers succeed in piercing 0.0119BTC.
- On the upside, the 100 hour simple moving average is a major hurdle for buyers.
Recent price action suggests that Dash prices might weaken in the near term if sellers get a reason to take it below 0.0119BTC.
0.0119BTC as a Support
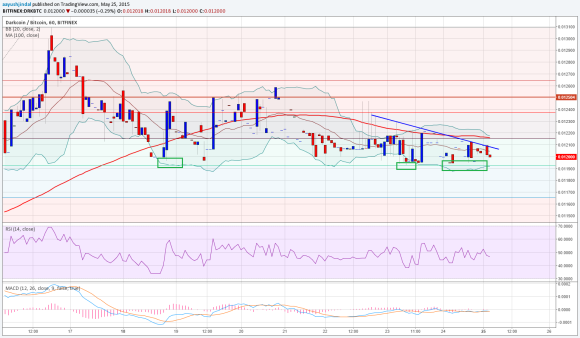
There is a major support formed around 0.0120-0.0119BTC that was also highlighted in the previous analysis. Prices recently fell a touch below 0.0120BTC, but found support around the 61.8% Fib retracement level of the last wave from 0.0112BTC to 0.0131BTC. If somehow sellers manage to take prices lower and Dash registers an hourly close below 0.0119BTC, then there is a great chance of a decline towards 0.01165BTC. The mentioned level represents the 76.4% Fib retracement level. Any more losses might call for a move towards the last swing low of 0.0112BTC.
There is a bearish trend line formed on the hourly chart of Dash, which is acting as a catalyst for sellers. As long as the price is below the mentioned trend line, Dash prices may perhaps fell in the short term. One crucial point to note is that the 100 hourly simple moving average is sitting just above the trend line, which might act as a barrier for Dash moving ahead.
In short, a break is near as there is a small gap between the 100 hourly SMA, and the stated support at 0.0119BTC.
Intraday Support Level – 0.0119BTC
Intraday Resistance Level – 0.0121BTC
Most technical indicators are suggesting more declines in the Dash price. The hourly RSI is below the 50 level with a chance of a convergence emerging. Let us see which way the price breaks moving ahead.
Charts courtesy of Trading View


