[Notice: All the price units are in Satoshi]
The Dogecoin price dropped around only 0.05% against the BTC in over the last 24 hours, but the overall bearish bias in its market continued to sustain.
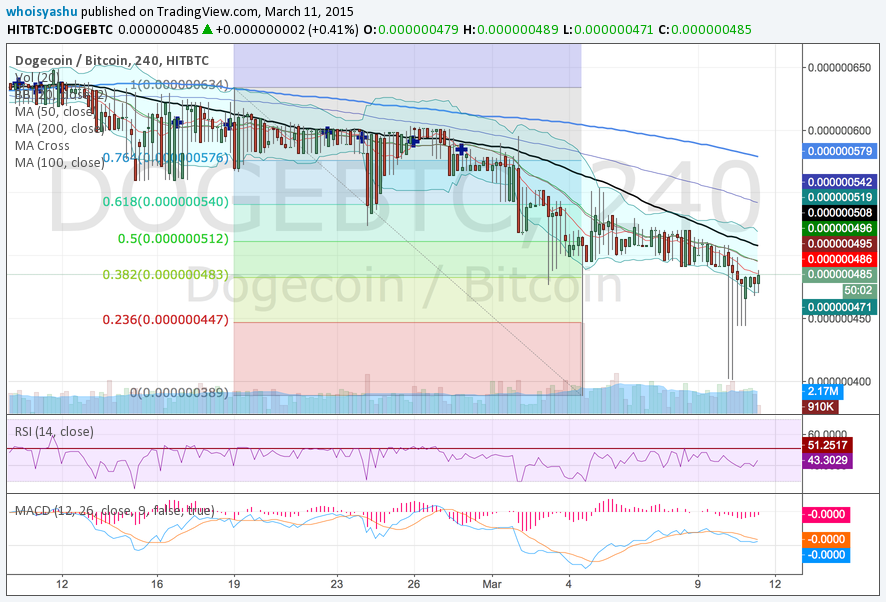
As you can see the 4H HITBTC chart above, the Dogecoin price continue to form lower lows near 40, adding further to the prevailing bearish bias. The Doge market has indeed reacted negatively to the Bitcoin’s celebrated bullish rally, as it simply took away a notable chunk of trading volume from the meme cryptocurrency. As a result, we can see how Dogecoin price which, on February 8th, was being valued around 65, gradually fell almost 40% by the time of this writing.
Speaking particularly of current trading session, the Dogecoin price is clearly attempting little corrections, but are still trending sideways in absence of enough buying volume. The price is way too below the 50-H MA, while the RSI is around 43 (above the red line is neutral territory, which RSI has failed to cross in last few weeks). The MACD is also too much dwelled inside the negative territory. These technical indicators clearly validates a stronger bearish bias in the upcoming hours, maybe even days.
We have also drawn a Fib retracement graph between Feb 19th higher high 63 and March 4th lower low 38 to better understand the entry/exit points in current trading scenario. The price is currently testing the 38.2% retracement level aligned with 48 as its next support/resistance pivot. The upside risk meanwhile is drawn towards 51. On the downside, the price trying to set a temporary support near 44, a point which also ensures a timely exit in case the selling pressure intensifies.
Conclusion
Exiting the trade near 51 would ensure a timely exit. Anything between 38 and 44 is a good buying opportunity.