Key Highlights
- Ethereum classic price finally broke the $16.60 resistance against the US Dollar.
- There is a major connecting bullish trend line forming with support at $16.60 on the hourly chart of ETC/USD (Data feed via Kraken).
- The broken resistance at $16.60 is now likely to act as a strong support for buyers in the near term.
Ethereum classic price climbed back in the bullish zone against the US Dollar and Bitcoin. ETC/USD tested $17.50 and remains supported on the downside.
Ethereum Classic Price Support
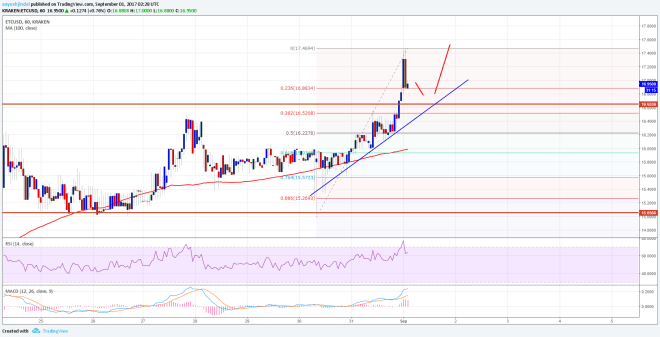
For a few days we saw ranging moves above $15.00 in ETC price against the US Dollar. The price finally made a nice upside move and cleared a major resistance near the $16.60 level. The upside move was such that the price even broke the $17.00 handle and traded as high as $17.46. At the moment, the price is correcting lower and testing the 23.6% Fib retracement level of the last wave from the $15.05 low to $17.46 high.
On the downside, there is a major connecting bullish trend line forming with support at $16.60 on the hourly chart of ETC/USD. The same trend line is positioned near the previous resistance at $16.60, which is likely to serve as a support in the short term. Moreover, the 38.2% Fib retracement level of the last wave from the $15.05 low to $17.46 high is at $16.52.
Therefore, we can say that ETC price remains supported on the downside near $16.60-16.50. As long as the price stays above $16.50, it is likely to resume its uptrend. On the upside, a break above $17.50 would push ETC towards the $18.00 handle. However, the most important hurdle remains at $20.00.
Hourly MACD – The MACD is back in the bullish zone and showing positive signs.
Hourly RSI – The RSI is retreating from the overbought levels.
Major Support Level – $16.60
Major Resistance Level – $17.50
Charts courtesy – Trading View, Kraken


