Key Highlights
- Ethereum classic price failed to hold the $14.00 support area against the US Dollar and moved down.
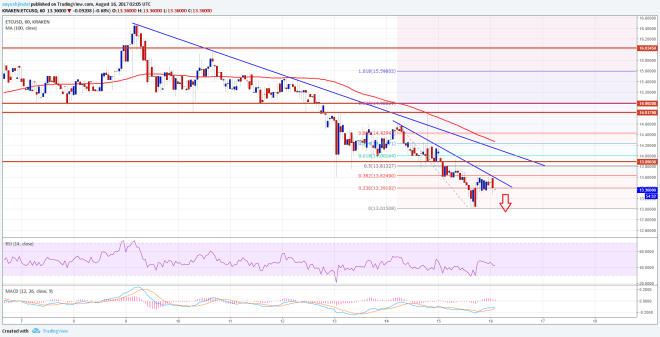
- There are two bearish trend lines forming with resistance at $13.60 and $14.00 on the hourly chart of ETC/USD (Data feed via Kraken).
- The price may struggle to move higher and could even trade towards the $12.80 level.
Ethereum classic price fell and remains under pressure against the US Dollar and Bitcoin. ETC/USD is currently below $14.00, eyeing a break of $13.00.
Ethereum Classic Price Decline
This week is turning out to be super bearish with a break of $14.00 in ETC price against the US Dollar. The past 2-3 days were bearish for ETC as it moved below two key support levels at $15.00 and $14.00. Every recovery was capped and Bitcoin price rise above $4000 added to the bearish pressure. ETC consolidated above the $14.00 level for some time, but eventually sellers were able to break the stated level.
The price declined and traded towards the $13.00 handle that provided support. At the moment, the price is recovering above the 23.6% Fib retracement level of the last decline from the $14.60 high to $13.01 low. There are two bearish trend lines forming with resistance at $13.60 and $14.00 on the hourly chart of ETC/USD. The second trend line is more important at $14.00 since it is positioned with the 100 hourly simple moving average. Moreover, the 50% Fib retracement level of the last decline from the $14.60 high to $13.01 low is at $13.80.
Therefore, it seems like the $13.80-14.00 area is a major resistance zone. Any upside move remains an opportunity to sell near $14.00 in the near term.
Hourly MACD – The MACD is attempting to settle in the bullish zone.
Hourly RSI – The RSI is currently well below the 50 level, signaling losses.
Major Support Level – $13.00
Major Resistance Level – $14.00
Charts courtesy – Trading View, Kraken


