Reason to trust

How Our News is Made
Strict editorial policy that focuses on accuracy, relevance, and impartiality
Ad discliamer
Morbi pretium leo et nisl aliquam mollis. Quisque arcu lorem, ultricies quis pellentesque nec, ullamcorper eu odio.
Key Highlights
- Ethereum classic price declined below the $13.00 support against the US Dollar, but later recovered.
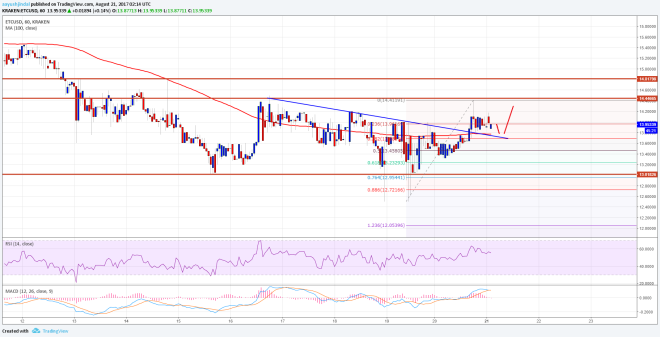
- There was a break above a short-term bearish trend line at $13.75 on the hourly chart of ETC/USD (Data feed via Kraken).
- The price is also above $13.80 and the 100 hourly simple moving average, which is a positive sign.
Ethereum classic price is currently recovering against the US Dollar and Bitcoin. ETC/USD needs to break $14.50-80 in order to move into the bullish zone.
Ethereum Classic Price Support
There was no major recovery above $14.00 in ETC price against the US Dollar. During the past few sessions, there was a decline below the $13.00 support as well. A low was formed near $12.50 from where the price recovered and moved back above $13.00. It gained pace and was able to clear the $13.50 resistance along with the 100 hourly simple moving average.
During the upside, there was a break above a short-term bearish trend line at $13.75 on the hourly chart of ETC/USD. The price is now comfortably placed above the $13.50 support and the 100 hourly simple moving average. However, it needs to gain momentum above $14.50 resistance if it has to move into the bullish zone. An initial support is around the 38.2% Fib retracement level of the last wave from the $12.50 low to $14.41 high. The $13.50 support is also near the broken trend line and the 100 hourly SMA.
Therefore, the $13.50 support is very important. As long as the price is above $13.50, it might attempt a break above $14.50. Under $13.50, the $13.00 support could be tested. Overall, ETC needs to gain momentum above $14.40 to remain in the bullish zone.
Hourly MACD – The MACD is slightly placed in the bullish zone.
Hourly RSI – The RSI is currently above the 50 level.
Major Support Level – $13.50
Major Resistance Level – $14.50
Charts courtesy – Trading View, Kraken


