Key Highlights
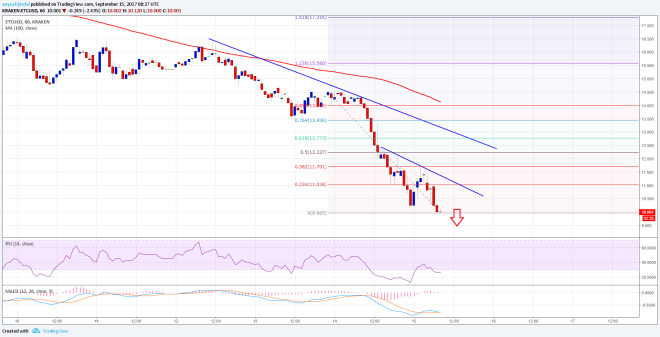
- Ethereum classic price nosedived and traded below the $10.00 support against the US Dollar.
- There are two bearish trend lines with resistance at $11.00 and $12.50 forming on the hourly chart of ETC/USD (Data feed via Kraken) is intact.
- The pair might correct a few points higher, but it is likely to face sellers near $11.00-11.70.
Ethereum classic price breaks down against the US Dollar and Bitcoin. ETC/USD is now below $11 and eyes a close of $10.
Ethereum Classic Price Nosedives
There were continuous bearish pressures on ETC and the price declined below the $12.50 level against the US Dollar. The decline was such that the price failed to hold the $11.00 support level as well. There was a tiny correction, but the upside was capped by the $11.70 level. The pair is now trading well below the $11.00 level and struggling to hold any support as of now.
It is currently trading just above the $10.00 support and buyers finding it hard to protect it. It seems like the price would soon break the stated $10.00 level and trade towards $10.00. The overall trend is very bearish and any upsides remain capped by $11.00. There are also two bearish trend lines with resistance at $11.00 and $12.50 forming on the hourly chart of ETC/USD. Moreover, the 23.6% Fib retracement level of the last drop from the $14.50 high to $9.96 low.
However, the price might not correct towards $11.00. If sellers remain in action, there can be a close below $10.00 for a move towards $9.00. The next major support sits at $8.00. Overall, selling rallies near $11.00 can be considered in the short term with a stop above $11.70.
Hourly MACD – The MACD is gaining momentum in the bearish zone.
Hourly RSI – The RSI is well into the oversold levels.
Major Support Level – $8.00
Major Resistance Level – $11.00
Charts courtesy – Trading View, Kraken


