Key Highlights
- Ethereum classic spiked higher as forecasted in yesterday’s post and then found sellers.
- There is currently a bearish trend line formed on the 30-min charts of ETC/BTC, which is acting as a hurdle for an upside move.
- The current price structure is bearish in the short term, but I still feel there is a chance of a surge towards 0.0035BTC before a major top.
Ethereum classic after moving higher found sellers and moved down. Can it continue heading lower or will it bounce back versus Bitcoin?
Ethereum Classic Resistance
Ethereum classic price ETC was on the rise yesterday. I was looking for an upside move before it starts trading lower. ETC followed the same path as I mentioned yesterday, and did test 0.0030BTC before moving down once again. Currently, Ethereum classic price is following a bearish path, as it is below the 100 simple moving average (30-min).
Moreover, there is a bearish trend line formed on the 30-min charts of ETC/BTC, which is acting as a resistance along with the 100 SMA. There may be a continuation of the current trend, and the price might test the 61.8% Fib retracement level of the last leg from the 0.0006BTC to 0.0048BTC.
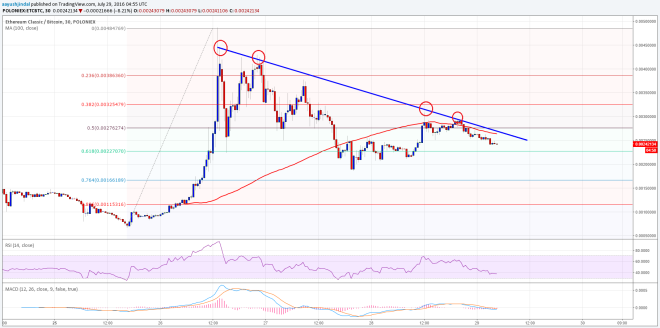

However, I am not convinced with the current price action in ETC to BTC, since there is a contrary signal forming on the MACD. The hourly RSI is also around the oversold readings. So, the price may dip from the current levels, but there lies a chance of another move higher before the price calls it a top. The 100 SMA may play a major role for the next move in ETCBTC in the near term.
Hourly MACD – The MACD is showing convergence, and calling for an upside move.
Hourly RSI – The RSI is around the oversold readings, which means the price may correct later.
Major Support Level – 0.0022BTC
Major Resistance Level – 0.0028BTC
Charts from Poloniex; hosted by Trading View