
Reason to trust
How Our News is Made
Strict editorial policy that focuses on accuracy, relevance, and impartiality
Ad discliamer
Morbi pretium leo et nisl aliquam mollis. Quisque arcu lorem, ultricies quis pellentesque nec, ullamcorper eu odio.
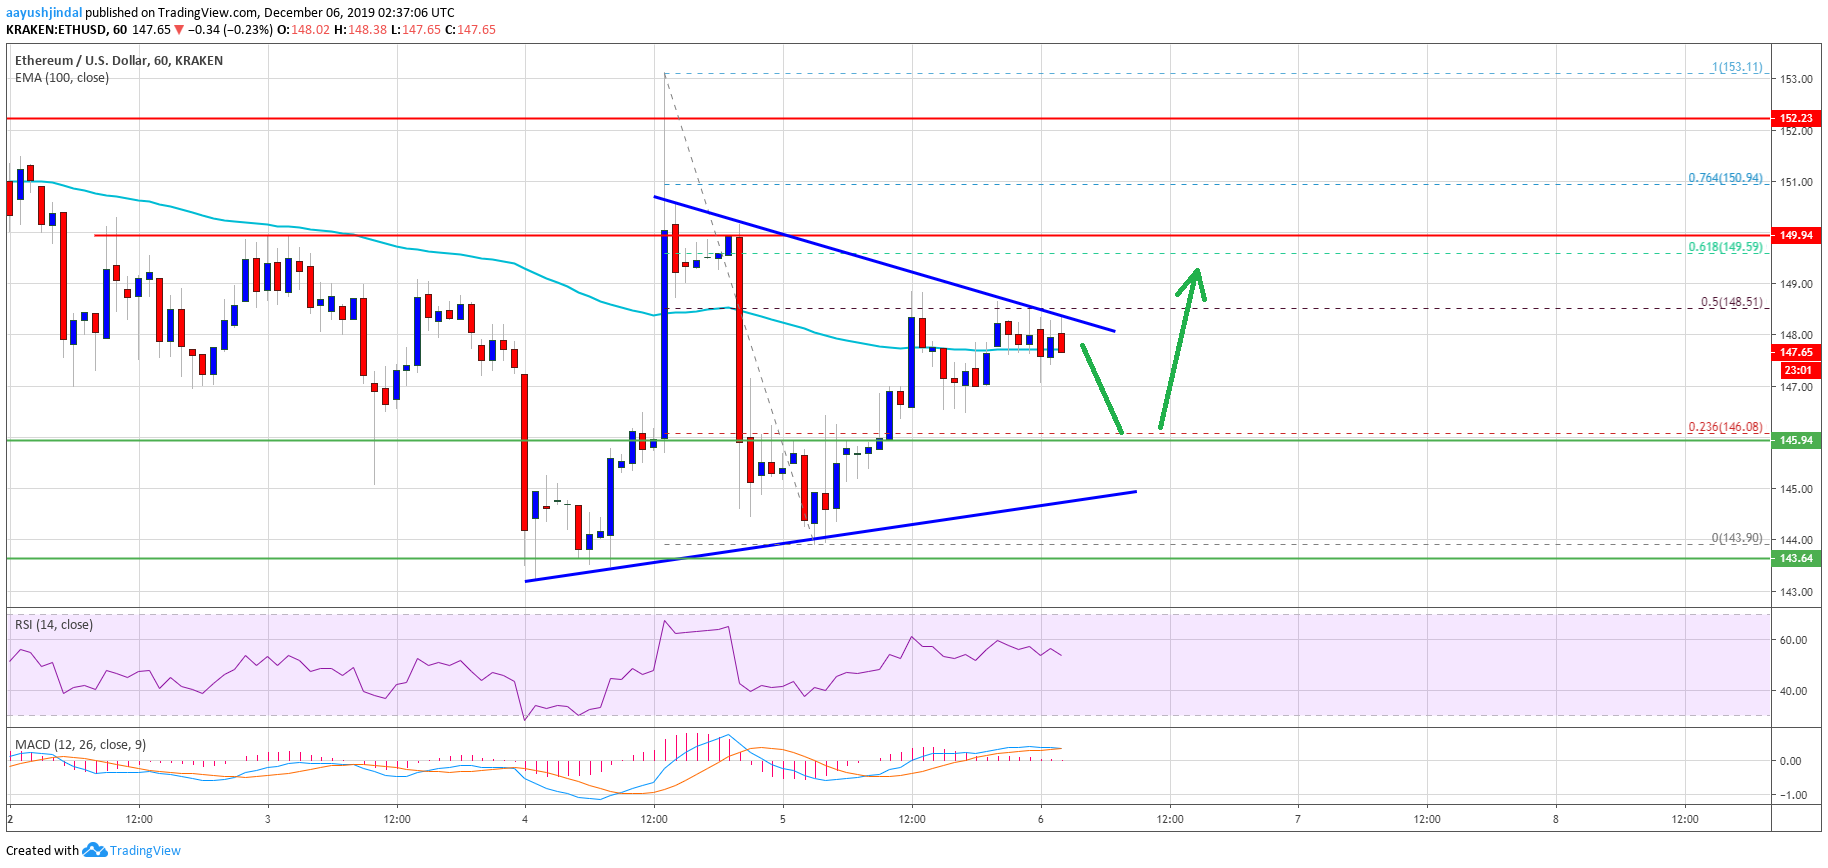
- Ethereum is slowly rising and it is trading above the $146 support area against the US Dollar.
- The price is facing a few strong resistances near $148, $150 and $152.
- There is a key contracting triangle forming with resistance near $148 on the hourly chart of ETH/USD (data feed via Kraken).
- The price could continue to rise towards the main $152 resistance in the near term.
Ethereum price is approaching important hurdles versus the US Dollar and bitcoin. ETH price must settle above $152 to continue higher in the near term.
Ethereum Price Analysis
Recently, Ethereum dived from the $152 resistance area and trimmed most gains against the US Dollar. However, ETH price managed to stay above the $144 support area and later recovered higher.
Moreover, the price surpassed the $146 resistance area and the 100 hourly simple moving average. The price also climbed above the 23.6% Fib retracement level of the recent decline from the $153 swing high to $144 swing low.
At the outset, the price is facing hurdles near the $148 resistance. Besides, there is a key contracting triangle forming with resistance near $148 on the hourly chart of ETH/USD.
More importantly, the 50% Fib retracement level of the recent decline from the $153 swing high to $144 swing low is also near the $148 level. Therefore, an upside break above the $148 resistance could push the price further higher.
Still, there are many resistances on the way up, starting with $150 and up to $152. Additionally, Ethereum price must settle above the $152 resistance to start a decent recovery and an upward move.
The next major hurdle is near the $158 level, above which the price could rally above $160. Conversely, the price could decline from $148 or $150. An immediate support is near the $146 pivot level.
The next support is near the triangle support at $145, below which there is a risk of a downside break below the $144 support area. If the bulls fail to defend the $144 support area, the bears are likely to aim the $140 support or even the $135 pivot level in the coming sessions.
Looking at the chart, Ethereum price is clearly making another attempt to surpass the $150 and $152 resistance levels. Thus, it could either rally above $152 or it might start a fresh decline towards the $140 and $135 levels.
ETH Technical Indicators
Hourly MACD – The MACD for ETH/USD is likely to move back into the bearish zone.
Hourly RSI – The RSI for ETH/USD is currently above the 50 level, with a few positive signs.
Major Support Level – $144
Major Resistance Level – $152


