
Reason to trust
How Our News is Made
Strict editorial policy that focuses on accuracy, relevance, and impartiality
Ad discliamer
Morbi pretium leo et nisl aliquam mollis. Quisque arcu lorem, ultricies quis pellentesque nec, ullamcorper eu odio.
Ethereum is up around 2% and it broke the key $210 resistance against the US Dollar. ETH price is showing positive signs and it could rise further, similar to bitcoin.
- Ethereum is slowly moving into a bullish zone above the $210 pivot level.
- The price traded towards the $218 level and it is currently correcting gains.
- There was a break above a key bearish trend line with resistance near $207 on the hourly chart of ETH/USD (data feed via Kraken).
- The pair is likely to remain well bid above $208 and $210 in the near term.
Ethereum Price Showing Bullish Signs
In the past few sessions, bitcoin rallied and broke the $10,000 resistance, resulting in bullish moves in Ethereum against the US Dollar. ETH price formed a strong support base above $200 and started a fresh increase.
There was a break above the key $208 and $210 resistance levels. The price even settled above the $210 level and the 100 hourly simple moving average.
During the rise, there was a break above a key bearish trend line with resistance near $207 on the hourly chart of ETH/USD. The pair gained strength above $215 and traded towards the $218 level.
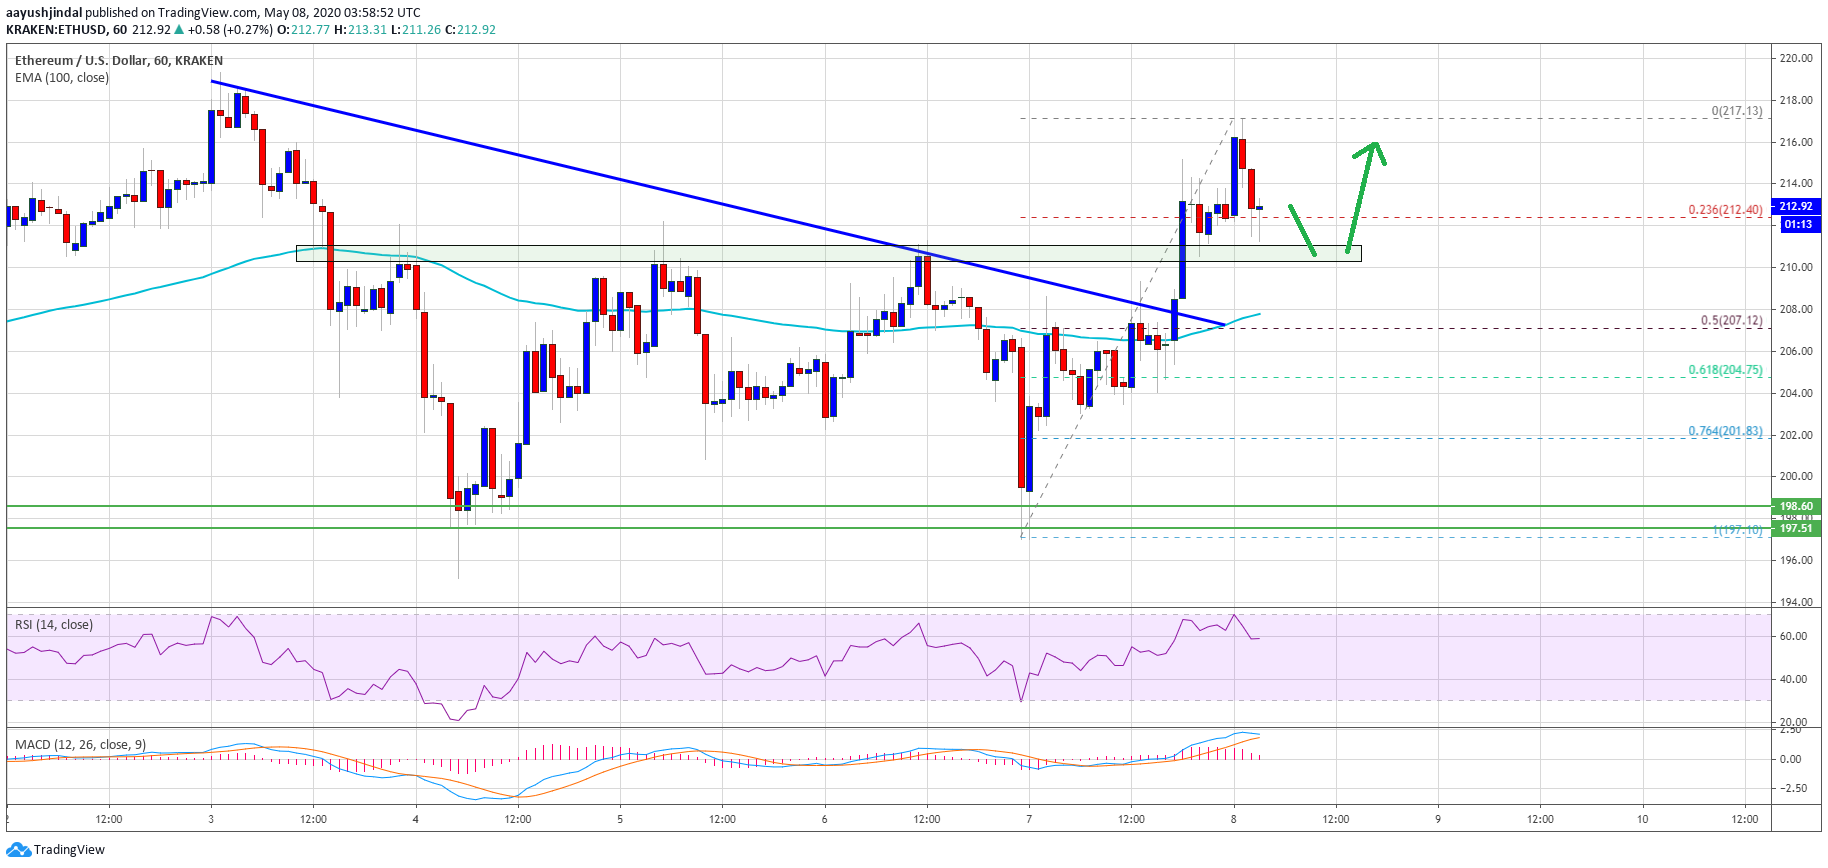
It seems like Ethereum struggled to gain pace above the $218 and $220 levels. It is currently correcting lower below $215. ETH traded below the 23.6% Fib retracement level of the recent rise from the $197 swing low to $218 high.
On the downside, the previous resistance near the $210 area is likely to act as a strong support. The next major support is seen near the $208 level and the 100 hourly simple moving average.
The 50% Fib retracement level of the recent rise from the $197 swing low to $218 high is also near the $207 level. Therefore, dips remain well supported and Ether price is likely to continue high above the $218 and $220 resistance levels. The next major resistance is seen near the $230 level.
Downside Extension?
If Ethereum fails to stay above the $210 and $208 support levels, it could extend its decline. The next support is seen near the $205 level.
The main support is now forming near the $198 level. if the bears succeed in clearing the $198 support zone, the price could move into a bearish zone.
Technical Indicators
Hourly MACD – The MACD for ETH/USD is about to move into the bearish zone.
Hourly RSI – The RSI for ETH/USD is currently correcting lower towards the 50 level.
Major Support Level – $208
Major Resistance Level – $220
Take advantage of the trading opportunities with Plus500
Risk disclaimer: 76.4% of retail CFD accounts lose money.


