Reason to trust
How Our News is Made
Strict editorial policy that focuses on accuracy, relevance, and impartiality
Ad discliamer
Morbi pretium leo et nisl aliquam mollis. Quisque arcu lorem, ultricies quis pellentesque nec, ullamcorper eu odio.
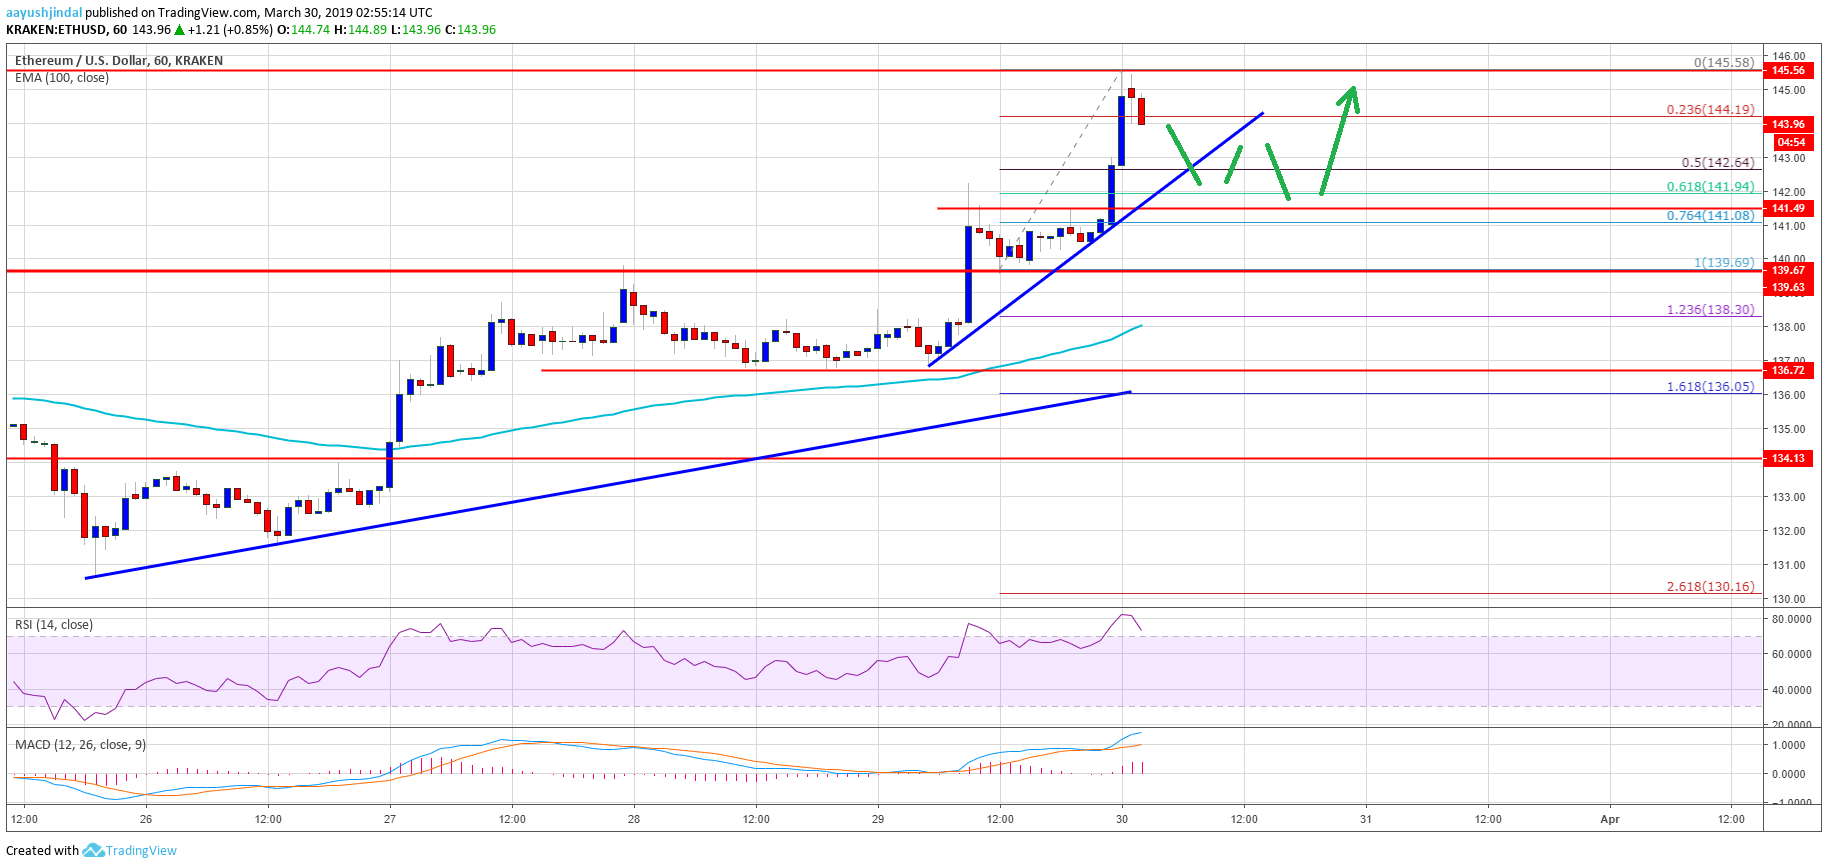
- ETH price extended upsides and gained bullish momentum above the $140 resistance against the US Dollar.
- The price even broke the $144 level and traded close to the $146 level before correcting lower.
- There is a key connecting bullish trend line formed with support above $143 on the hourly chart of ETH/USD (data feed via Kraken).
- There could be a downside correction, but the $141-142 support area is likely to act as a strong support.
Ethereum price is moving nicely in a positive trend against the US Dollar and bitcoin. ETH remains supported on dips and it seems like bulls are aiming for the $150 level.
Ethereum Price Analysis
Yesterday, we discussed about possible more gains above the $140 resistance in ETH price against the US Dollar. The ETH/USD pair dipped a few points, but it found a solid support near the $137 level. Later, there was a fresh increase and the price rallied above the $142 and $144 resistance level. The price even broke the $144 level and spiked above the $145 resistance. A new swing high was formed close to the $146 level and the price is currently correcting lower.
At the outset, the price is trading well above the $140 support and the 100 hourly simple moving average. It is currently trading near the 23.6% Fib retracement level of the recent wave from the $140 swing low to $146 swing high. There is also a key connecting bullish trend line formed with support above $143 on the hourly chart of ETH/USD. It seems like the price may correct below the trend line and $142 in the short term. However, the $141 level may act as a strong support area.
Besides, the 50% Fib retracement level of the recent wave from the $140 swing low to $146 swing high might also prevent declines. Once the current correction is complete, there are chances of more gains above the $144 and $145 levels. A clear follow through above the $146 level might call for a test of the $150 resistance level.
Looking at the chart, Ethereum price is trading in a positive trend above the $142 and $141 support levels. The next key support is near the $139 level, which was a strong resistance earlier. In the short term, there could be a downside correction or range moves near $142. Having said that, the price is likely to resume its upside and trade towards the $150 level in the near term.
ETH Technical Indicators
Hourly MACD – The MACD for ETH/USD is placed nicely in the bullish zone.
Hourly RSI – The RSI for ETH/USD is currently correcting lower from the 80 level.
Major Support Level – $141
Major Resistance Level – $146