
Reason to trust
How Our News is Made
Strict editorial policy that focuses on accuracy, relevance, and impartiality
Ad discliamer
Morbi pretium leo et nisl aliquam mollis. Quisque arcu lorem, ultricies quis pellentesque nec, ullamcorper eu odio.
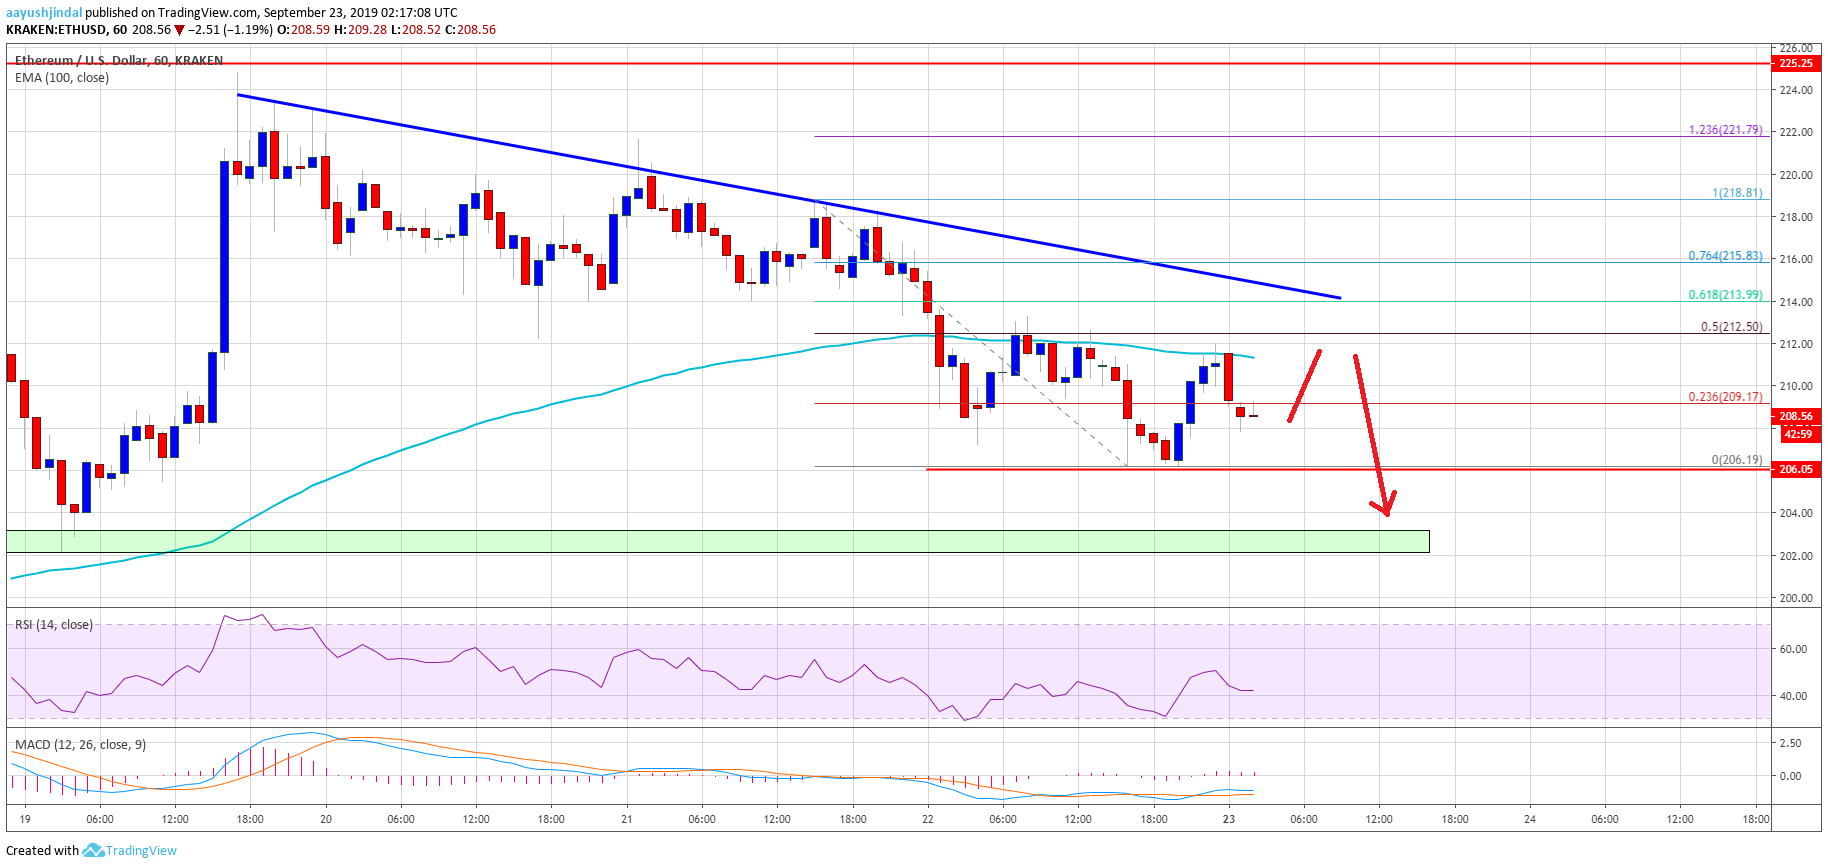
- ETH price is currently correcting lower and it recently broke the $212 support against the US Dollar.
- The price is facing a lot of hurdles on the upside near the $212 and $215 levels.
- There is a key bearish trend line forming with resistance near $214 on the hourly chart of ETH/USD (data feed via Kraken).
- The pair could extend its decline towards the $200-$202 support area before starting a fresh increase.
Ethereum price is currently declining below $212 versus the US Dollar, similar to bitcoin. ETH price is likely to retest the $200 support area before the bulls might take a stand.
Ethereum Price Analysis
After testing the $225 level, ETH price started a downside correction against the US Dollar. The price broke the $215 and $212 support levels to move into a short term bearish zone. Moreover, there was a close below the $212 level and the 100 hourly simple moving average. The recent decline gained pace below the $210 level and the price traded as low as $206.
At the moment, Ethereum price is correcting higher above the $210 level. It broke the 23.6% Fib retracement level of the recent decline from the $218 high to $206 low. However, the bears are protecting the $212 resistance area and the 100 hourly SMA. Moreover, the 50% Fib retracement level of the recent decline from the $218 high to $206 low is sitting tight near the $212 level.
There is also a key bearish trend line forming with resistance near $214 on the hourly chart of ETH/USD. The trend line is close to the 61.8% Fib retracement level of the recent decline from the $218 high to $206 low. Therefore, the price is likely to face a lot of hurdles near the $212 and $215 levels. To start a solid upward move, the price must climb above the $215 level and settle above the 100 hourly SMA.
On the downside, an immediate support is near the $206 low. However, the main support is near the $202 and $200 levels. It seems like the price could extend its decline towards the $200 support area before it might start a decent upward move.
Looking at the chart, Ethereum price is clearly trading in a short term bearish zone below the $212 and $215 levels. If there is an upside break above $215, the price will most likely climb towards the $225 monthly high. If not, the price could revisit $200.
ETH Technical Indicators
Hourly MACD – The MACD for ETH/USD is slowly moving into the bullish zone.
Hourly RSI – The RSI for ETH/USD is currently below the 50 level, with a few bearish signs.
Major Support Level – $202
Major Resistance Level – $215