
Reason to trust
How Our News is Made
Strict editorial policy that focuses on accuracy, relevance, and impartiality
Ad discliamer
Morbi pretium leo et nisl aliquam mollis. Quisque arcu lorem, ultricies quis pellentesque nec, ullamcorper eu odio.
Ethereum surged close to 20% and climbed above the $170 resistance against the US Dollar. However, ETH price is struggling to gain momentum above the 100-day simple moving average.
- Ethereum is up close to 20% and it broke the $155 and $165 resistance levels against the US Dollar.
- The price even tested the $175 resistance and the 100-day simple moving average.
- There is a crucial bearish trend line forming with resistance near $182 on the daily chart of ETH/USD (data feed via Kraken).
- The pair must climb above the $180 resistance and the 100-day SMA to move into a larger uptrend.
Ethereum Price Jumps Significantly
In the past few sessions, there was a sharp increase in Ethereum above the $150 resistance (as discussed yesterday) against the US Dollar. ETH price outpaced bitcoin and rallied close to 20% to trade above the $165 resistance.
During the rise, there was a clear break above the $155 resistance. The price even climbed above the 23.6% Fib retracement level of the last major decline from the $252 high to $90 swing low.
The price traded above the $170 level, but it seems like it is facing a strong resistance near the $175 level and the 100-day simple moving average. The 50% Fib retracement level of the last major decline from the $252 high to $90 swing low is also acting as a resistance.
More importantly, there is a crucial bearish trend line forming with resistance near $182 on the daily chart of ETH/USD. If Ethereum succeeds in clearing the $175 and $182 resistance levels, it could move into a medium term uptrend.
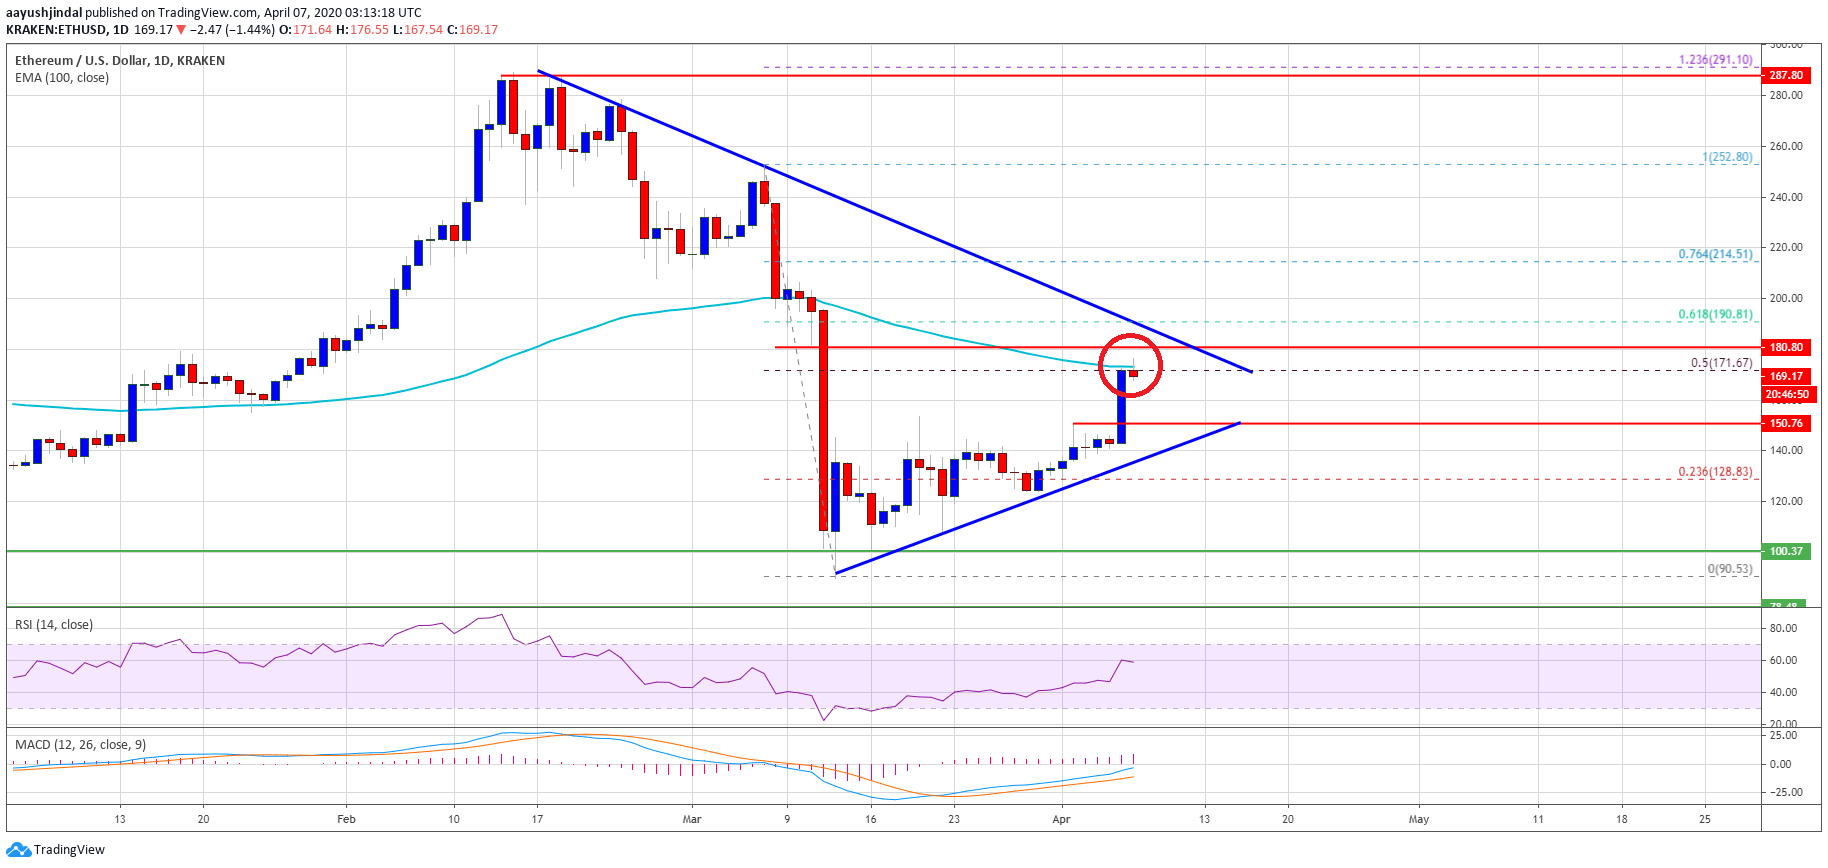
The next key resistance is near the $190 level, above which the bulls are likely to aim a test of the $200 barrier. Any further gains could lead the price towards the $220 level in the near term.
Rejection Near $175-$180?
If Ethereum fails to clear the $175 and $180 resistance levels, it could correct lower. An initial support on the downside is near the $160 level.
The first major support is now near the $150 level and a connecting bullish trend line on the same chart. A successful daily close below the $150 support level could start another decline. The next key support is seen near the $124 level.
Technical Indicators
Daily MACD – The MACD for ETH/USD is now gaining momentum in the bullish zone.
Daily RSI – The RSI for ETH/USD is currently well above the 50 level.
Major Support Level – $150
Major Resistance Level – $180
Take advantage of the trading opportunities with Plus500
Risk disclaimer: 76.4% of retail CFD accounts lose money.