
Reason to trust
How Our News is Made
Strict editorial policy that focuses on accuracy, relevance, and impartiality
Ad discliamer
Morbi pretium leo et nisl aliquam mollis. Quisque arcu lorem, ultricies quis pellentesque nec, ullamcorper eu odio.
Ethereum is showing a lot of bearish signs below $200 against the US Dollar. ETH price is likely to extend losses below $185 and $180 in the near term.
- Ethereum is struggling to recover above the $195 and $200 resistance levels against the US Dollar.
- The price is likely to dive further below the $180 support level in the near term.
- There is a key bearish trend line forming with resistance near $192 on the hourly chart of ETH/USD (data feed via Kraken).
- Bitcoin price broke the $7,700 support and it is declining towards the key $7,500 support.
Ethereum Price Could Extend Losses
After a short term correction, Ethereum faced a strong resistance near the $195 level against the US Dollar. ETH price declined and traded below the $185 support level.
A new weekly low was formed near $181 and the price settled well below the 100 hourly simple moving average. Recently, there was a minor upward move above the $190 level.
The price surpassed the 23.6% Fib retracement level of the recent decline from the $207 high to $181 low. However, the bulls faced a lot of hurdles near the $195 and $196 levels. There is also a key bearish trend line forming with resistance near $192 on the hourly chart of ETH/USD.
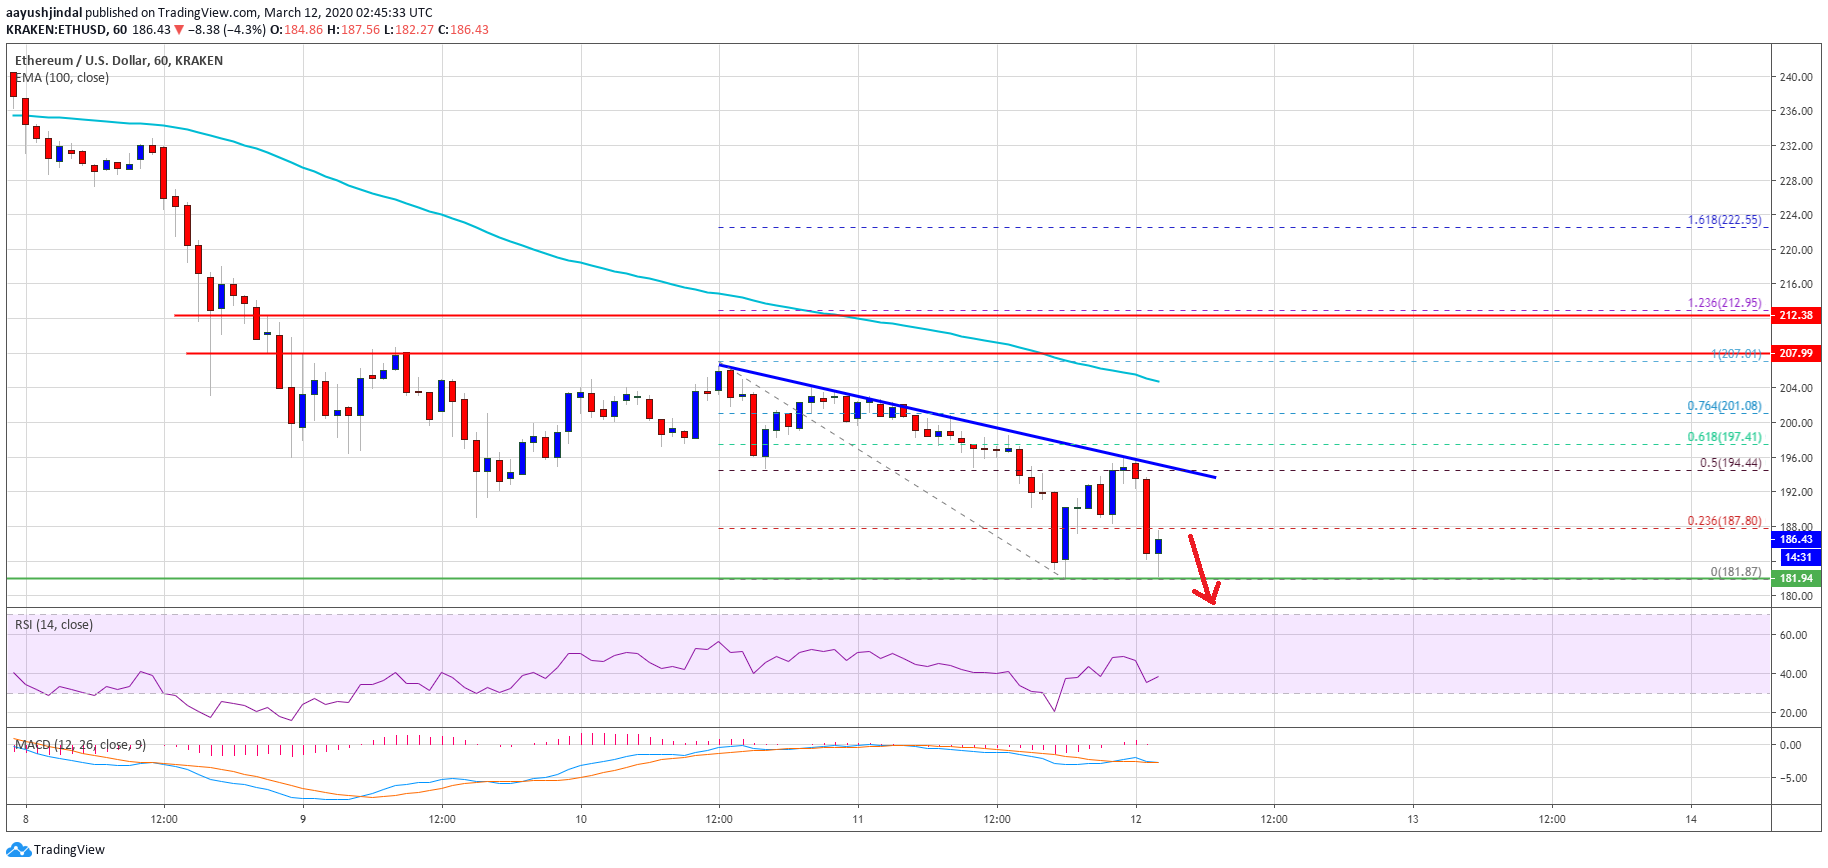
Ethereum also failed to clear the 50% Fib retracement level of the recent decline from the $207 high to $181 low. It is currently declining and trading near the $182 support area.
If there is a downside break below the $182 support, there is a risk of more downsides in the near term below $180. The next support is near the $172 level, below which the price may perhaps test the $165 support. Any further losses could open the doors for a push towards the $150 level.
Chances of a Recovery?
If Ethereum manages to stay above the $182 and $180 support levels, it could make another attempt to correct higher. An initial resistance is near the $192 level.
The first major resistance is near the $1995 level, above which the bulls are likely to make an attempt to push the price above the $205 and $208 resistance levels in the coming days.
Technical Indicators
Hourly MACD – The MACD for ETH/USD is slowly gaining momentum in the bearish zone.
Hourly RSI – The RSI for ETH/USD is currently well below the 40 level, with a bearish angle.
Major Support Level – $180
Major Resistance Level – $195


