
Reason to trust
How Our News is Made
Strict editorial policy that focuses on accuracy, relevance, and impartiality
Ad discliamer
Morbi pretium leo et nisl aliquam mollis. Quisque arcu lorem, ultricies quis pellentesque nec, ullamcorper eu odio.
Ethereum defied gravity and trading with a bullish bias above $135 against the US Dollar, similar to bitcoin. ETH price is likely to continue higher above the $150 level.
- ETH price remains well supported above the $135 and $138 levels against the US Dollar.
- The price is showing positive signs and likely to surge above the $150 level in the near term.
- There is a key bullish trend line forming with support near $140 on the 4-hours chart of ETH/USD (data feed via Kraken).
- Bitcoin is also showing a lot of positive signs above the $8,000 support area.
Ethereum Price Could Break $150
This past week, there were bullish moves in Ethereum above $132 against the US Dollar. ETH rallied towards the $135 level, later corrected lower, and now finally trading higher with a positive bias above the $135 level.
A new yearly high was formed near $148 and the price started a downside correction. There was a break below the 23.6% Fib retracement level of the upward move from the $135 low to $148 high.
However, the decline was protected by the $140 area and the price is now well above the 100 simple moving average (4-hours). Moreover, the 50% Fib retracement level of the upward move from the $135 low to $148 high is acting as a strong support.
More importantly, there is a key bullish trend line forming with support near $140 on the 4-hours chart of ETH/USD. If there is a downside break below the trend line below $138, there is a risk of a strong decline.
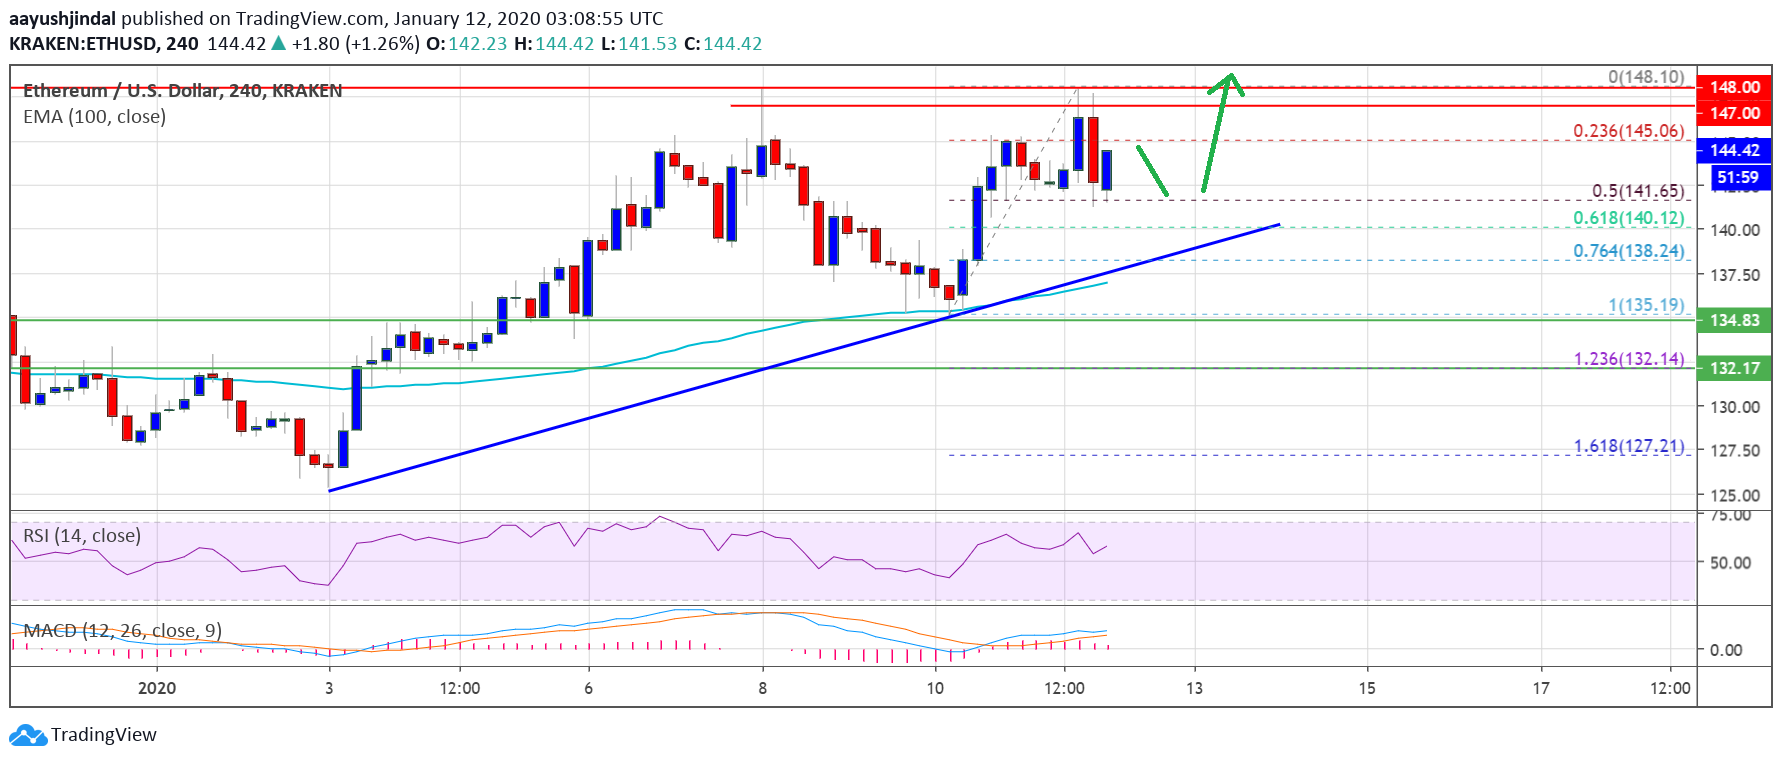
On the upside, there are key hurdles near the $145 and $148 levels. A clear break above the $148 level could set the pace for a bullish break above the $150 level in the coming sessions.
What’s Bearish Case for Ethereum?
The main support on the downside is near the $137 level and the 100 SMA. If there is a downside break below the $137 and $135 levels, there is a risk of a clear bearish break.
Therefore, a successful break and close below the $135 level might set the pace for a fresh decline. The next key support is near $130, below which it may perhaps open the doors for a push towards the $125 level.
The above chart indicates that Ethereum price is showing a lot of positive signs above $135 and it likely to surge above the $150 level.
Technical Indicators
4 hours MACD – The MACD for ETH/USD is gaining strength in the bullish zone.
4 hours RSI – The RSI for ETH/USD is currently well above the 50 level.
Major Support Level – $135
Major Resistance Level – $148