
Reason to trust
How Our News is Made
Strict editorial policy that focuses on accuracy, relevance, and impartiality
Ad discliamer
Morbi pretium leo et nisl aliquam mollis. Quisque arcu lorem, ultricies quis pellentesque nec, ullamcorper eu odio.
Ethereum is showing positive signs above $225 against the US Dollar. ETH price is likely forming a bullish breakout pattern and it could soon rally above $235-$238.
- Ethereum is forming a nice bullish formation above the $220 support area against the US Dollar.
- The price is likely to surge above $230 and $235 to start a fresh rally in the near term.
- There is a contracting triangle forming with resistance near $230 on the hourly chart of ETH/USD (data feed via Kraken).
- Bitcoin price is also likely to start a strong rally after the recent rate cut from the fed.
Ethereum Price Could Rally Soon
After testing the $235 resistance, Ethereum started a downside correction against the US Dollar. ETH price corrected below the $232 and $230 support levels.
Besides, there was a break below the 50% Fib retracement level of the recent rise from the $212 low to $235 high. It even spiked below the $225 support and tested the $220 support level, which acted as a strong buy zone.
It seems like the bulls are able to defend the 61.8% Fib retracement level of the recent rise from the $212 low to $235 high. Ethereum is now climbing higher and trading above the $225 level and the 100 hourly simple moving average.
More importantly, there is a contracting triangle forming with resistance near $230 on the hourly chart of ETH/USD. A convincing break above the $230 resistance level could open the doors for a fresh rally.
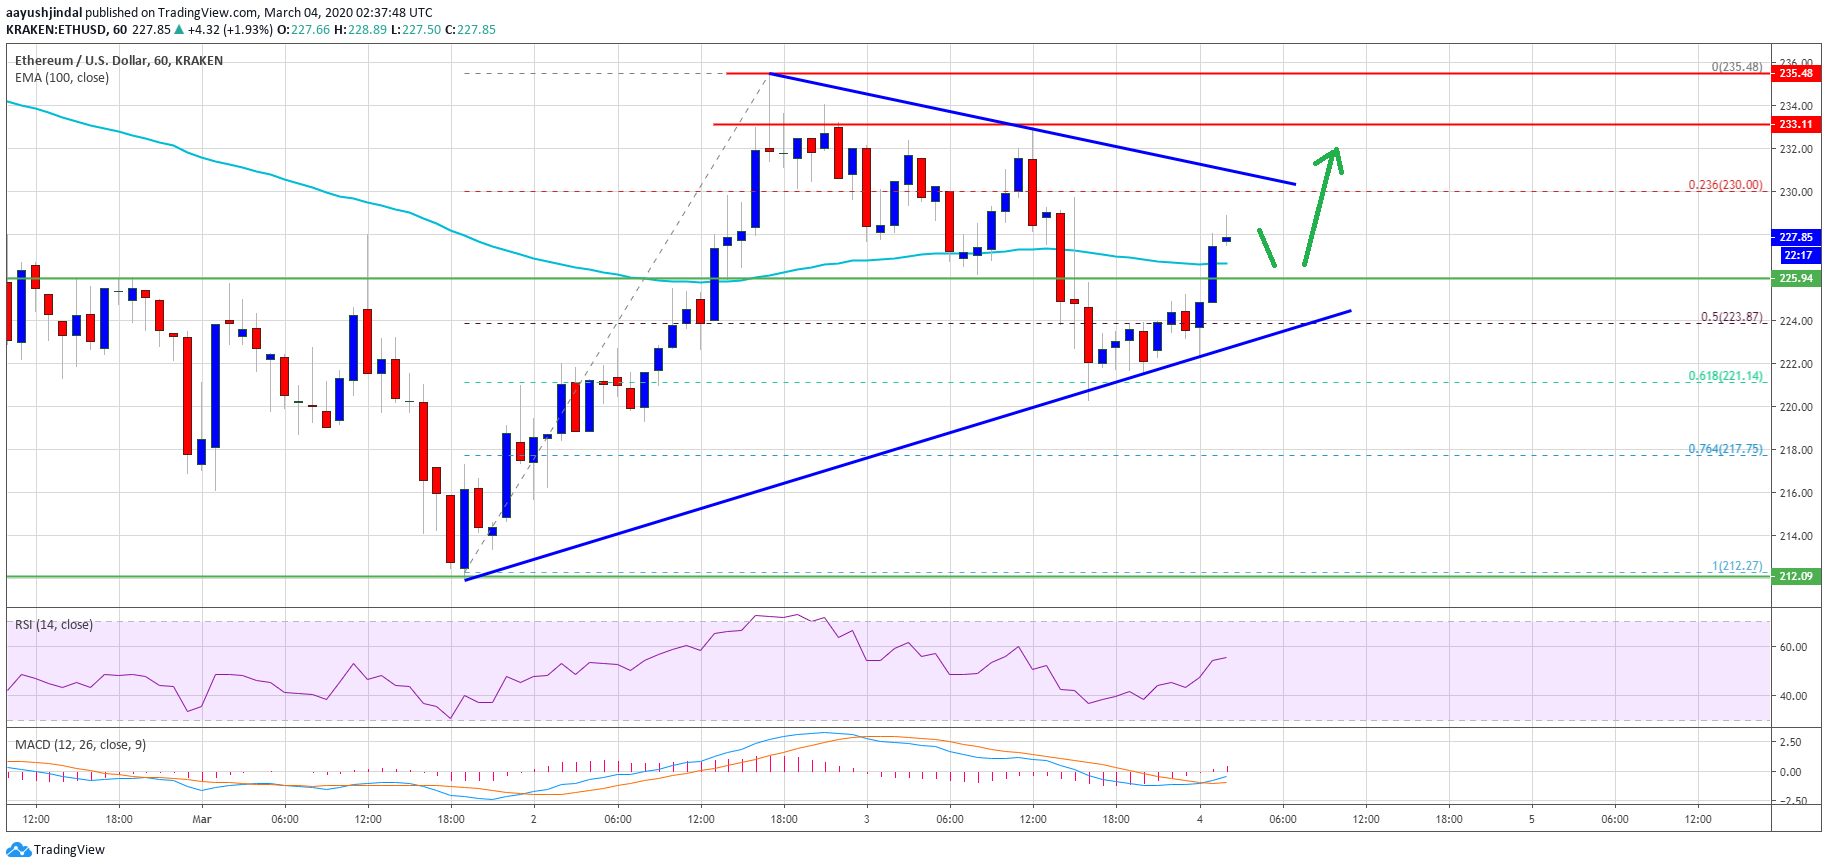
The main hurdles are near the $235 level, above which the bulls are likely to aim a test of the $250 and $255 resistance levels in the coming sessions. Any further gains could lead the price towards the $265 resistance zone.
$235 As Key Resistance
If Ethereum fails to surpass the $230 and $235 resistance levels, there is a risk of another bearish reaction. An initial support is near the $225 level, followed by the triangle support.
If the bulls fail to protect the triangle support, it will invalidate the bullish bias and the price might dive below the $220 support level. The next key support is near the $215 level. Any further losses may perhaps lead the price towards the $212 swing low in the near term.
Technical Indicators
Hourly MACD – The MACD for ETH/USD is slowly moving into the bullish zone.
Hourly RSI – The RSI for ETH/USD is back above the 50 level, with positive signs.
Major Support Level – $225
Major Resistance Level – $235


