
Reason to trust
How Our News is Made
Strict editorial policy that focuses on accuracy, relevance, and impartiality
Ad discliamer
Morbi pretium leo et nisl aliquam mollis. Quisque arcu lorem, ultricies quis pellentesque nec, ullamcorper eu odio.
Key Highlights
- ETH price failed to stay above the $146 support and declined heavily against the US Dollar.
- There is a short term bearish trend line formed with resistance at $128 on the hourly chart of ETH/USD (data feed via Kraken).
- The pair may correct a few points towards $130, but it is likely to extend declines below $120.
Ethereum price declined heavily during the past few hours against the US Dollar and bitcoin. ETH/USD could test $110 or $105 if it fails to recover above $128 and $136.
Ethereum Price Analysis
Yesterday, we saw a solid support near the $144-146 zone for ETH price against the US Dollar. The ETH/USD pair recently failed to break the $150-151 zone and a bearish trend line. It resulted in a sharp bearish reaction and the price declined below the $146 and $144 supports. Sellers gained control and pushed the price below the $130 level. There was even a close below the $130 level and the 100 hourly simple moving average. A low was formed near $122 and later the price started consolidating losses.
An initial resistance is the 23.6% Fib retracement level of the recent drop from the $151 high to $122 swing low. Moreover, there is also a short term bearish trend line formed with resistance at $128 on the hourly chart of ETH/USD. If there is a break above the trend line and $128, the price may recover further. The next key resistance is near the $126 level. The stated level represents the 50% Fib retracement level of the recent drop from the $151 high to $122 swing low. A proper close above the $136 level is needed for a decent recovery in the near term.
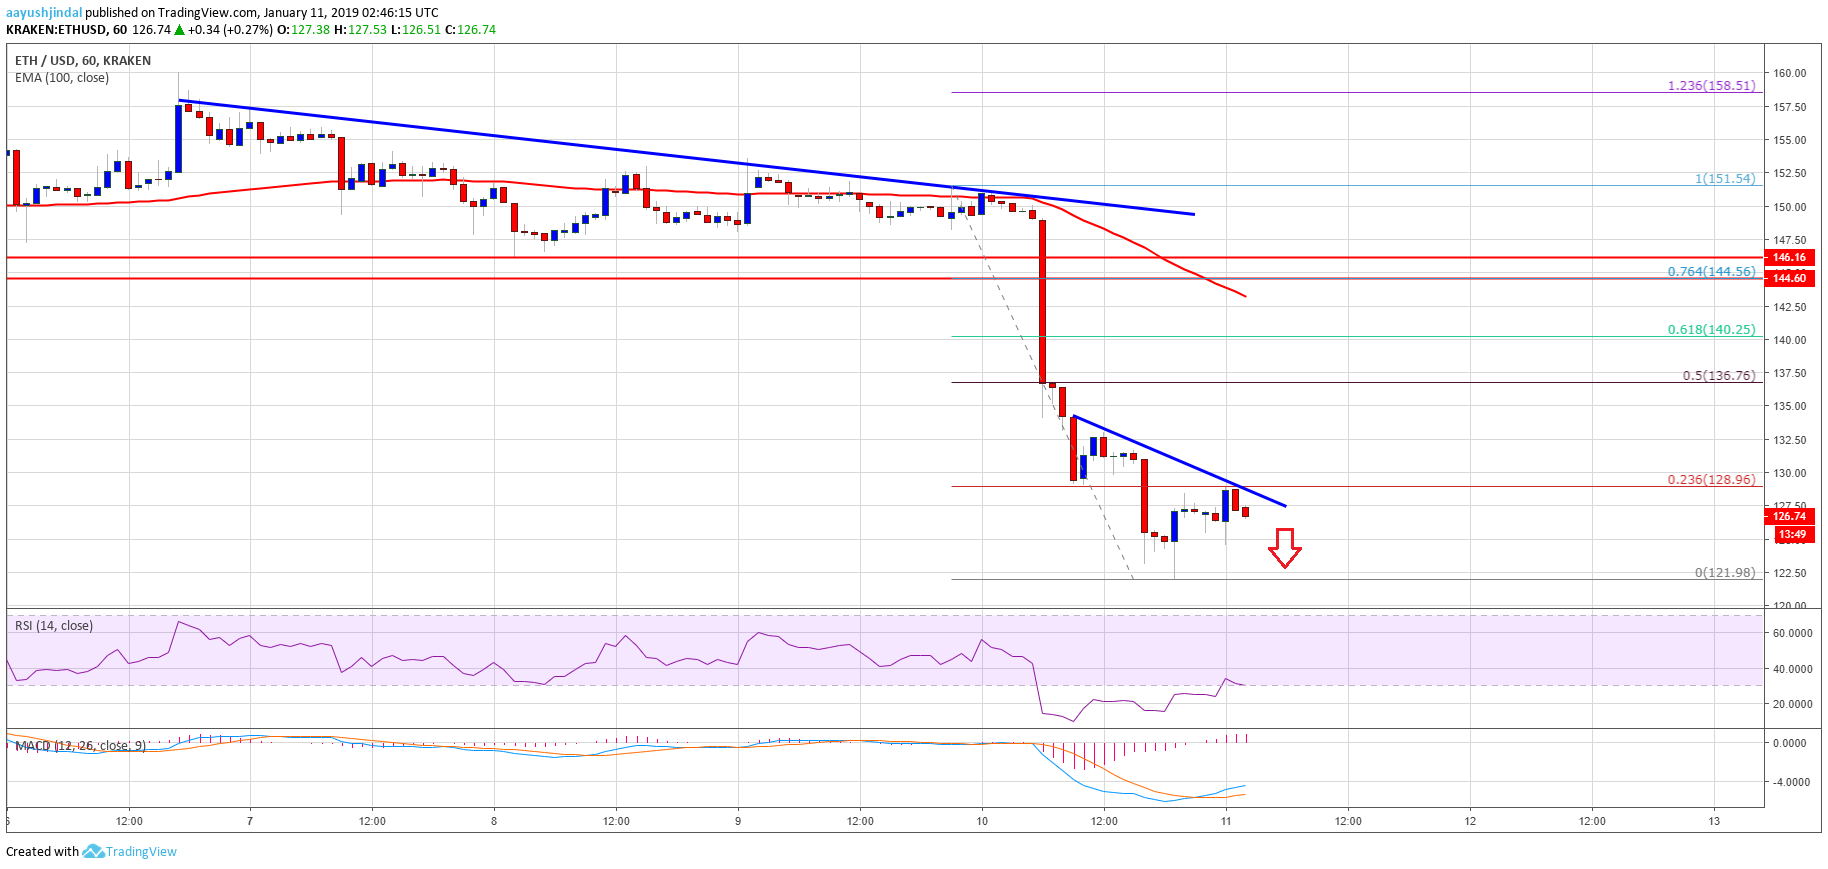
Looking at the chart, ETH price clearly made a sharp U-turn below the $146 support. As long as the price is below $136, there is a risk of more losses. A break below $122 and $121 may push the price towards $110.
Hourly MACD – The MACD for ETH/USD is slowly moving in the bullish zone, but the overall bias is still negative.
Hourly RSI – The RSI for ETH/USD is currently recovering from the oversold zone.
Major Support Level – $121
Major Resistance Level – $136


