
Reason to trust
How Our News is Made
Strict editorial policy that focuses on accuracy, relevance, and impartiality
Ad discliamer
Morbi pretium leo et nisl aliquam mollis. Quisque arcu lorem, ultricies quis pellentesque nec, ullamcorper eu odio.
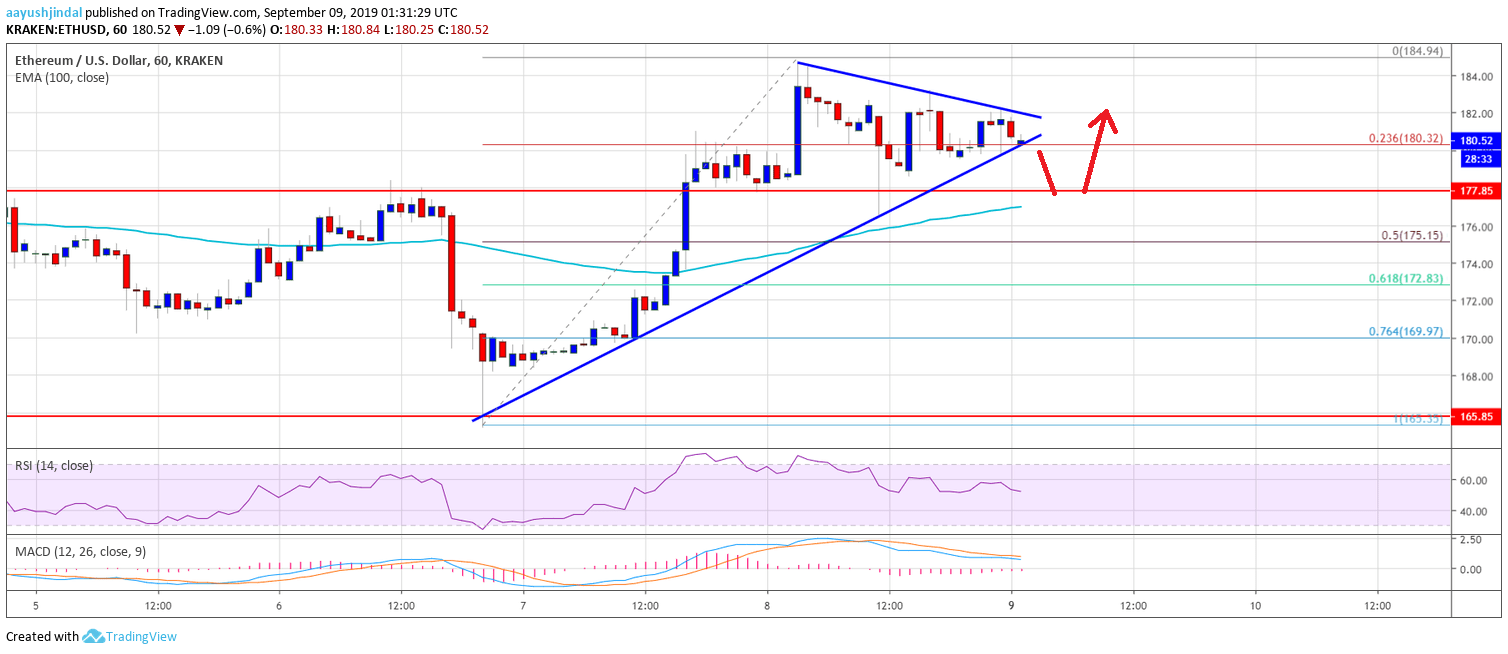
- ETH price climbed higher recently and settled above the $175 resistance area against the US Dollar.
- The price is currently consolidating gains and it might continue to rise towards $185 or $190.
- There is a key breakout pattern forming with support near $180 on the hourly chart of ETH/USD (data feed via Kraken).
- The price could dip a few points towards $176 or $175 before it could start a fresh increase.
Ethereum price is showing positive signs above $175 versus the US Dollar, while bitcoin is struggling. ETH price remains supported on dips and it could rise further.
Ethereum Price Analysis
Recently, there was a solid rise in ETH price above the $175 resistance area against the US Dollar. However, bitcoin price struggled to gain momentum above the $10,500 resistance area. The recent rise in pushed Ethereum above the $180 level and the 100 hourly simple moving average. Moreover, the price traded close to the $185 level and recently started a short term downside correction.
It traded below the $180 level and the tested the 23.6% Fib retracement level of the upward move from the $165 low to $185 high. At the outset, there is a key breakout pattern forming with support near $180 on the hourly chart of ETH/USD. It seems like the price might decline a few points below the trend line support at $180. The next key support is near the $178 level and the 100 hourly SMA.
Additionally, the 50% Fib retracement level of the upward move from the $165 low to $185 high is near the $175 level to act as a support. If the price continues to slide, there are chances of a trend reversal towards the $170 support area. The 76.4% Fib retracement level of the upward move from the $165 low to $185 high is also near $170. Conversely, an immediate resistance on the upside is near the $182 level.
If there is an upside break above the $182 level, the price could attempt to surpass the $185 resistance area. Above $185, the price is likely to continue higher towards the $190 and $192 resistance levels.
Looking at the chart, Ethereum price is clearly trading with a positive bias above the $175 and $178 support levels. Only an hourly close below $175 might negate the current positive bias. On the upside, the price will most likely gain bullish momentum once it clears the $182 and $185 resistance levels.
ETH Technical Indicators
Hourly MACD – The MACD for ETH/USD is currently moving in the bearish zone.
Hourly RSI – The RSI for ETH/USD is currently declining and it struggling to hold the 50 level.
Major Support Level – $175
Major Resistance Level – $185


