
Reason to trust
How Our News is Made
Strict editorial policy that focuses on accuracy, relevance, and impartiality
Ad discliamer
Morbi pretium leo et nisl aliquam mollis. Quisque arcu lorem, ultricies quis pellentesque nec, ullamcorper eu odio.
- ETH price traded to a new monthly high close to $240 before correcting lower against the US Dollar.
- The price is currently holding an important support near the $222 and $224 levels.
- Yesterday’s highlighted important bullish trend line is active with support near $224 on the hourly chart of ETH/USD (data feed via Kraken).
- The pair could bounce back as long as there is no daily close below the $220 support area.
Ethereum price is trading above a couple of important supports versus the US Dollar, and bitcoin retreated from well above $12,000. ETH price might climb higher again as long as above $220.
Ethereum Price Analysis
Yesterday, there was a sharp rise in bitcoin and Ethereum price above $12,200 and $230 respectively against the US Dollar. The ETH/USD pair even traded above the $235 resistance and settled above 100 hourly simple moving average. The pair traded close to the $240 level and formed a new monthly high. However, the bulls failed to break the $240 resistance. As a result, there was a sharp downside correction below the $235 and $230 support levels.
Moreover, there was a break below the 50% Fib retracement level of the last rally from the $216 low to $240 swing high. The price even declined below the $225 support and spiked below the 100 hourly SMA. However, the $222 support level acted as a support. Additionally, the 76.4% Fib retracement level of the last rally from the $216 low to $240 swing high acted as a support.
More importantly, yesterday’s highlighted important bullish trend line is active with support near $224 on the hourly chart of ETH/USD. At the moment, the price is currently trading above the $222 and $224 support levels. On the upside, an immediate resistance is near the $228 level. If there is an upside break above $228 and $230, the price may climb back towards the $240 level.
On the other hand, a close below the trend line, the 100 hourly SMA, and $220 could spark another bearish wave in the near term. The next important support for the bulls below $220 is near the $212 level.
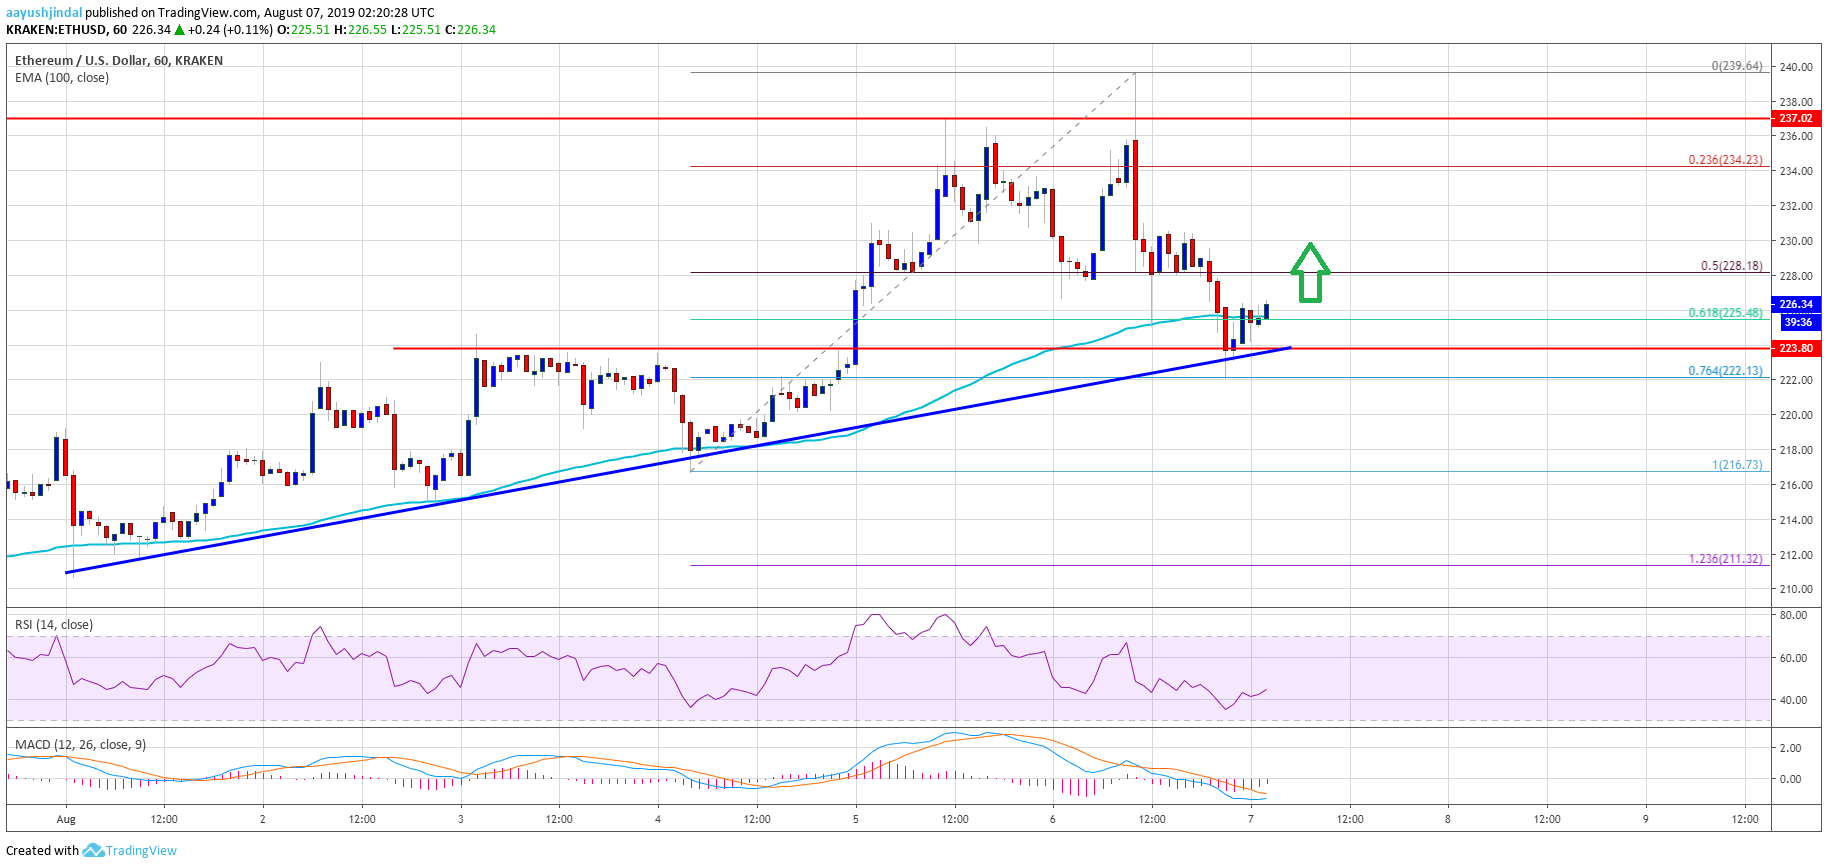
Looking at the chart, Ethereum price is currently holding a couple of key uptrend supports above $220. Therefore, as long as the price is above $220, there could be a slow and steady rise. A successful break above $230 is needed for a decent rise towards the $235 and $240 resistances.
ETH Technical Indicators
Hourly MACD – The MACD for ETH/USD is likely to move back into the bullish zone.
Hourly RSI – The RSI for ETH/USD is currently moving higher towards the 50 level.
Major Support Level – $220
Major Resistance Level – $230


