Key Highlights
- Ethereum price managed to correct higher a few points against the US Dollar but found sellers on the upside.
- The price stalled and found offers on a couple of occasions near the 100 hourly simple moving average.
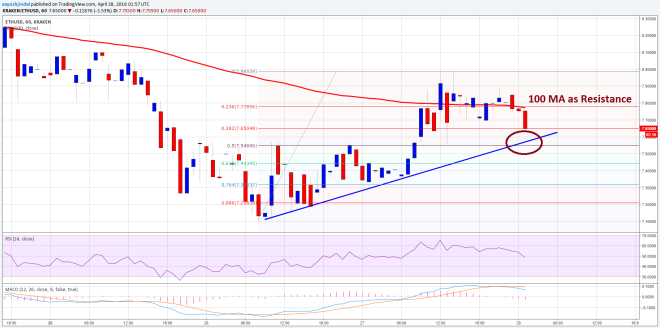
- There is a bullish trend line formed on the hourly chart (data feed via Kraken) of ETH/USD, which may act as a support area in the short term.
Ethereum price recent correction looks impressive. However, ETH/USD needs to clear 100 hourly SMA to gain further strength.
Ethereum Price – Can Trend Line Hold?
Ethereum price ETH finally showed some signs of life and moved higher after trading towards $7.00. There was a nice upside reaction, but the price found offers near the 100 hourly simple moving average. There was no proper hourly close above the 100 SMA, which can be seen as a concern for the ETH bulls. Moreover, the price failed to break the $8.00 resistance area as well, which is another negative sign.
However, there is a hope for the bulls, as there is a bullish trend line formed on the hourly chart (data feed via Kraken) of ETH/USD. The highlighted trend line and support area hold a lot of importance in the near term. As long as the price is above it, there is a possibility of ETH spiking one more time, but I would not suggest to enter a buy, as I am not convinced with the current price action.

I would rather wait and see if the price breaks the trend line and support area. If there is an hourly close below the trend line support, then there is a chance of a move down back towards $7.20.
Hourly MACD – The MACD is in the bearish zone, suggesting the bears are fighting hard to stop the upside move.
Hourly RSI – The RSI just dipped below the 50 level, which may ignite a downside move.
Intraday Support Level – $7.50
Intraday Resistance Level – $8.00
Charts courtesy of Kraken via Trading View


