Key Highlights
- ETH price declined over the weekend against the US Dollar and traded below the $11.60 support.
- There is a major bearish trend line on the hourly chart (data feed via SimpleFX) of ETH/USD, which may act as a hurdle for the ETH bulls moving ahead.
- If the price corrects higher from the current levels, then the $11.20-40 levels can act as a resistance.
Ethereum price ETH faced a lot of heat over the weekend and moved down versus the USD. It looks poised for more declines in the near term.
Ethereum Price Sell
Ethereum price ETH weakened recently, as sellers had an upper hand versus the bulls. There was a decline below an important support area, which may now result in more losses in the short term. Please note, this is my short-term view, not a trend setter. The ETH/USD pair recently traded as low as $10.59 where it found buyers and started to correct higher.
However, a recovery won’t be easy, as there is a major bearish trend line on the hourly chart (data feed via SimpleFX) of ETH/USD. Moreover, the 100 hourly simple moving average is also aligned around the same trend line to act as a barrier for more gains. Currently, the price is trading near the 23.6% Fib retracement level of the last drop from the $12.03 high to $10.59 low.
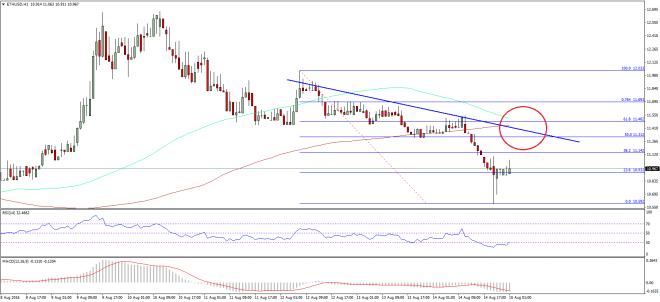

It may easily gain more bids and correct further. However, we need to keep a close eye on the 50% Fib retracement level of the last drop from the $12.03 high to $10.59 low. Overall, the $11.20-40 levels can be considered as a major resistance if the pair continues to correct higher from the current levels.
Hourly MACD – The MACD is placed well in the bearish zone, which is not a good sign.
Hourly RSI – The RSI is around the oversold readings, calling for an extension of the current correction wave.
Major Support Level – $10.60
Major Resistance Level – $11.40
Charts courtesy – SimpleFX