

Key Highlights
- Ethereum price continued to trade in a range vs the US Dollar and annoyed many traders with no real move.
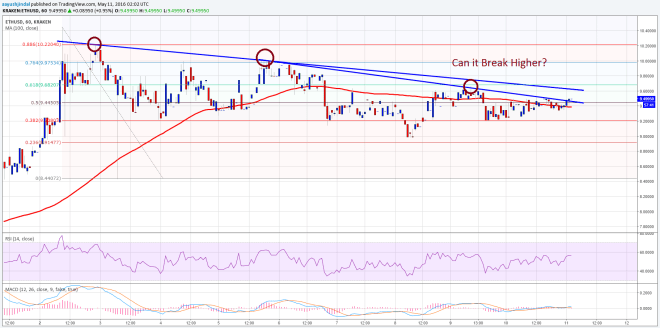
- There are a couple of bearish trend lines formed on the hourly chart (data feed via Kraken) of ETH/USD, which are acting as a resistance.
- ETH bulls are struggling to gain momentum, and as a result, there was no break and a move higher.
Ethereum price after dipping a few points towards $9.20 found support. It looks like ETH/USD is struggling to gain pace in the short term.
Ethereum Price Directionless Moves
Ethereum price ETH showed no signs of bullish moves, and continued to trade in a tiny range. It looks like the ETH bulls are not able to find a solid reason to take the price higher. We can say that ETH/USD is currently directionless and it may continue to trade in a range in the short term. There are a couple of bearish trend lines formed on the hourly chart (data feed via Kraken) of ETH/USD, which may ignite moves.
The price just moved above the 100 hourly simple moving average, but it simply lags momentum, which can be also seen from the MACD histogram. However, if there is a break above the trend lines and resistance area, then a move towards the 76.4% Fibonacci retracement level of the last drop from the $10.40 high to $8.40 is possible.

I would not suggest any trade idea in ETH/USD since there is no real direction, and I don’t like the current price action. So, it’s better to wait until we have some momentum to trade and take advantage.
Hourly MACD – The MACD is almost flat, and showing that there is no real action in ETH/USD at present.
Hourly RSI – The RSI is above the 50 level, but we need to see whether the bulls are really up for a break or not.
Intraday Support Level – $9.20
Intraday Resistance Level – $9.60
Charts courtesy of Kraken via Trading View
Image via NewsBTC