Key Highlights
- ETH price failed to move further above $433 and started a downside move against the US Dollar.
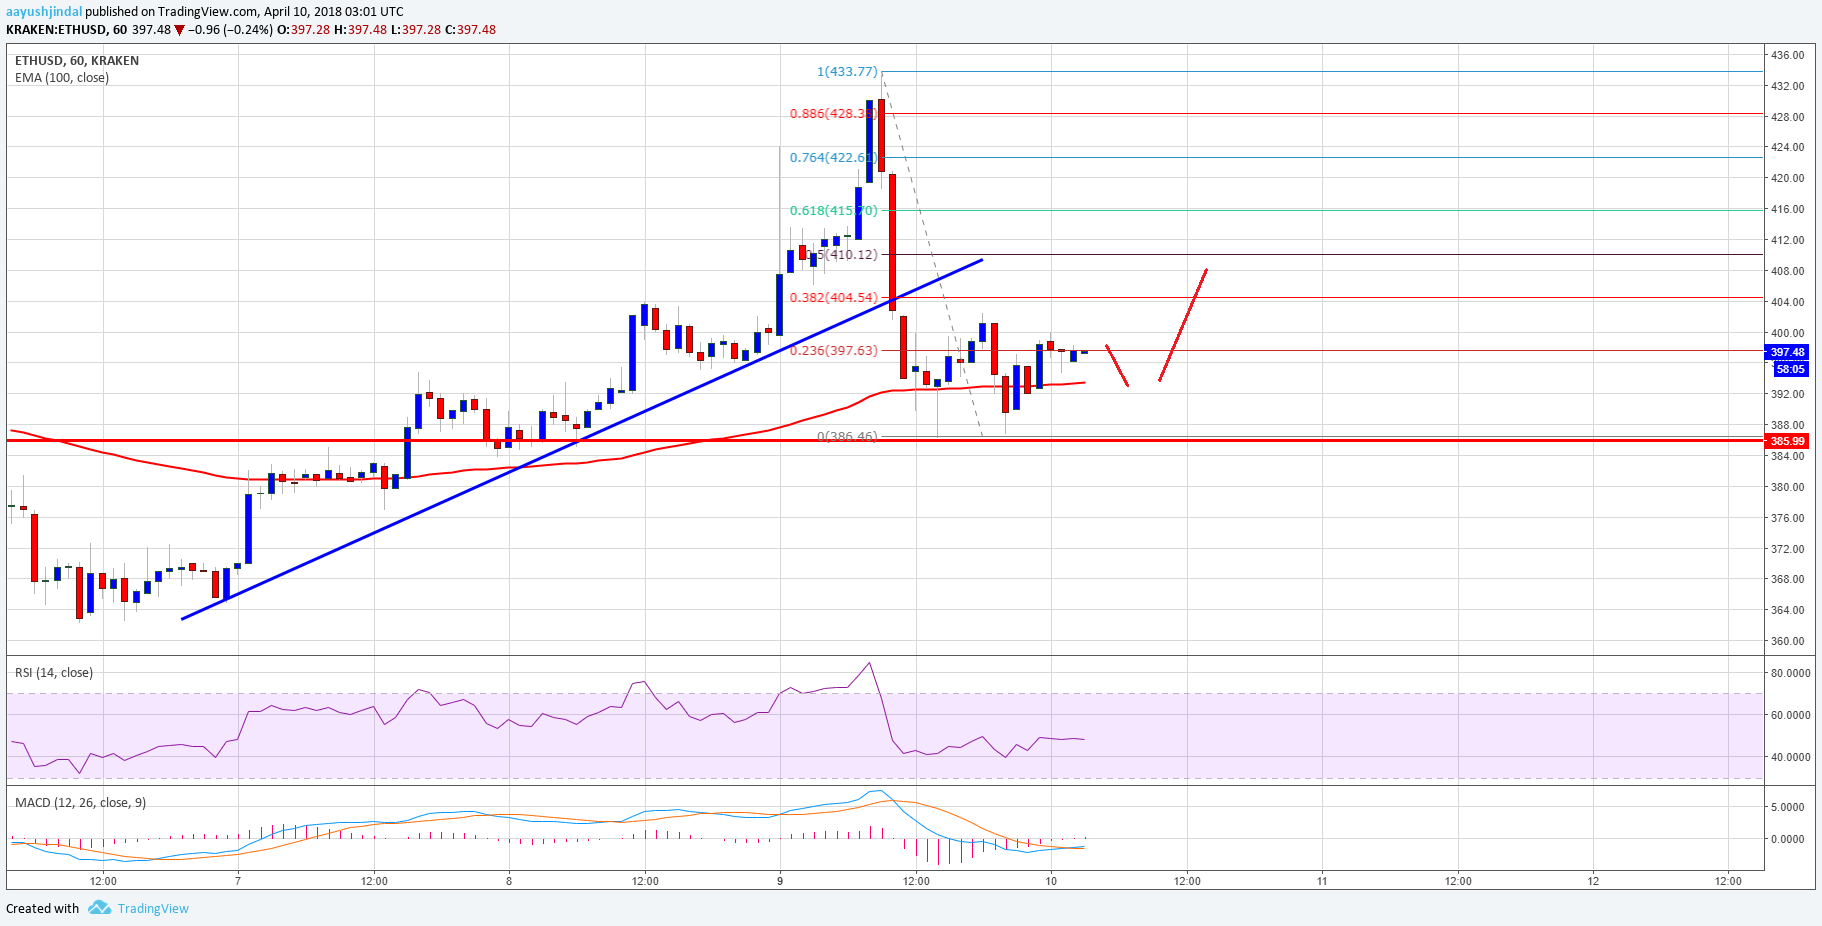
- Yesterday’s highlighted major bullish trend line with support at $404 was broken on the hourly chart of ETH/USD (data feed via Kraken).
- The pair is currently holding the $385 level and the 100 hourly simple moving average.
Ethereum price is slightly under bearish pressure against the US Dollar and Bitcoin. ETH/USD must stay above the 100 hourly SMA to recover once again.
Ethereum Price Trend
Yesterday, there was a decent upside move above the $400 level in ETH price against the US Dollar. The price even traded above the $430 level, but it could not gain momentum. A high was formed at $433.77 from where the price started a downside move. It declined and moved below the 50% Fib retracement level of the last wave from the $383 low to $433 high.
Moreover, yesterday’s highlighted major bullish trend line with support at $404 was broken on the hourly chart of ETH/USD. It opened the doors for more losses and the price almost tested the $385 level. A low was formed at $386.46 before buyers appeared. At the moment, the price is recovering, and trading above $390 and the 100 hourly simple moving average. It has to break the 23.6% Fib retracement level of the last decline from the $433 high to $386 low to gain further. Once there is a proper break and close above $400, the price might trade above the $415 level in the near term.

On the flip side, if there is a break below the $386 low, the price could decline further. On the downside, the next major support below $386 is at $370.
Hourly MACD – The MACD is now back in the bearish zone.
Hourly RSI – The RSI fell and is currently well below the 50 level with neutral signals.
Major Support Level – $386
Major Resistance Level – $400
Charts courtesy – Trading View


