Key Highlights
- ETH price made a minor low at $7.40 against the US Dollar, and started correcting higher.
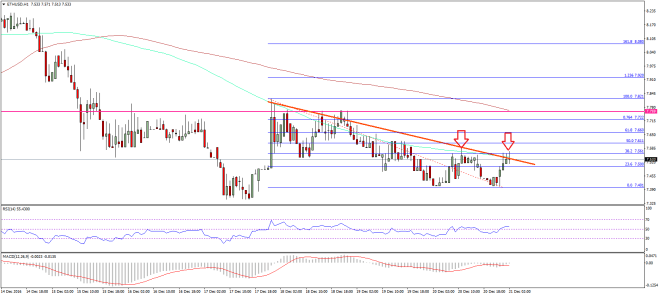
- There is a bearish trend line formed on the hourly chart (data feed via SimpleFX) of ETH/USD, which the pair is attempting to break at the moment.
- A close above the trend line resistance may call for a move towards $7.75.
Ethereum price after a dip against the US Dollar started recovering. The ETH/USD pair currently is looking to break a short-term resistance.
Ethereum Price Resistance
There was a minor decline in ETH price versus the US Dollar yesterday, as the price traded below $7.50 and made a minor intraday low at $7.40. There was a move below the 76.4% Fib retracement level of the last wave from the $7.34 low to $7.82 high to complete the wave. The price later started a recovery, and climbed above the 23.6% Fib retracement level of the last decline from the $7.82 high to $7.40 low.
However, the upside move is currently facing a monster resistance near $7.55. It is comprised of a few important hurdles. First, there is a bearish trend line formed on the hourly chart (data feed via SimpleFX) of ETH/USD. Second, the 38.2% Fib retracement level of the last decline from the $7.82 high to $7.40 low. And, the last one is the 100 hourly simple moving average. All these hurdles are acting as a resistance at the moment and preventing more gains above $7.55.
If there is a successful break above $7.55, there is a chance of a move towards the all-important $7.75-80 resistance area. Overall, the price may range trade and attempt to post gains in the short term.
Hourly MACD – The MACD is about to change the slope from the bearish to bullish slope.
Hourly RSI – The RSI is above the 50 level, and heading north.
Major Support Level – $7.40
Major Resistance Level – $7.75
Charts courtesy – SimpleFX


