Reason to trust

How Our News is Made
Strict editorial policy that focuses on accuracy, relevance, and impartiality
Ad discliamer
Morbi pretium leo et nisl aliquam mollis. Quisque arcu lorem, ultricies quis pellentesque nec, ullamcorper eu odio.
Key Highlights
- ETH price dived yesterday against the US Dollar and Bitcoin after Donald Trump won the US President Seat.
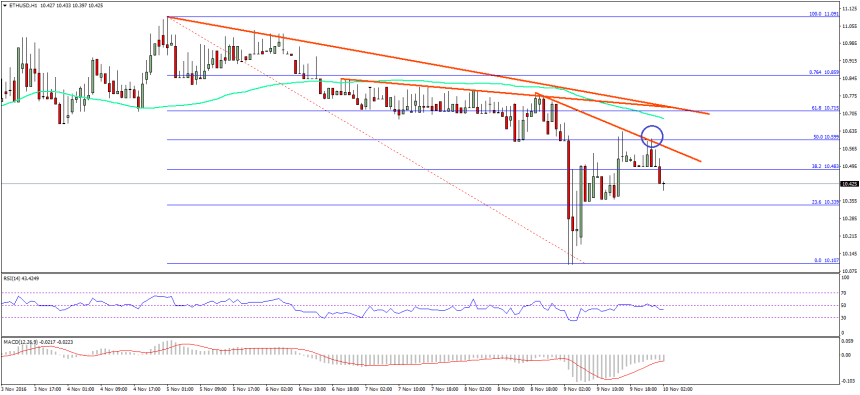
- There are a few bearish trend lines formed on the hourly chart (data feed via SimpleFX) of ETH/USD, which are acting as a crucial resistance at $10.60-65.
- As long as the price is below the stated resistance levels, it remains under a bearish pressure.
Ethereum price declined yesterday after the US presidential election outcome, and it looks like it is currently under a major resistance area against the US Dollar.
Ethereum Price Resistance
ETH price faced a lot of pressure yesterday against the US Dollar after Donald Trump won the US President Seat. There was a decline below the $10.50 support area, taking the price back towards the $10.10 level. The price is currently correcting higher, but it won’t be easy for it to recover. There is a monster resistance formed near $10.60-65, which may prevent any upside move in ETH.
There are many reasons why the highlighted resistance area is important. First, there are a few bearish trend lines formed on the hourly chart (data feed via SimpleFX) of ETH/USD aligned. Second, the 100 hourly simple moving average is positioned just above it. Lastly, the 50% Fib retracement level of the decline from the $11.09 high to $10.107 low is also around the same area.
So, it is quite clear that the $10.60-65 represents a major resistance zone. If the price moves higher, it could face sellers. One may even consider selling near the highlighted resistance area with a tight stop. However, one must not forget that the ETH may not remain low for this long. In time it may get catalyst for a move higher.
Hourly MACD – The MACD is reducing the bearish slope, which is a slight contraction signal.
Hourly RSI – The RSI is struggling to break the 50 level, which is a concern.
Major Support Level – $10.30
Major Resistance Level – $10.65
Charts courtesy – SimpleFX


