

Key Highlights
- ETH price moved down and broke a key support area at $760 against the US Dollar.
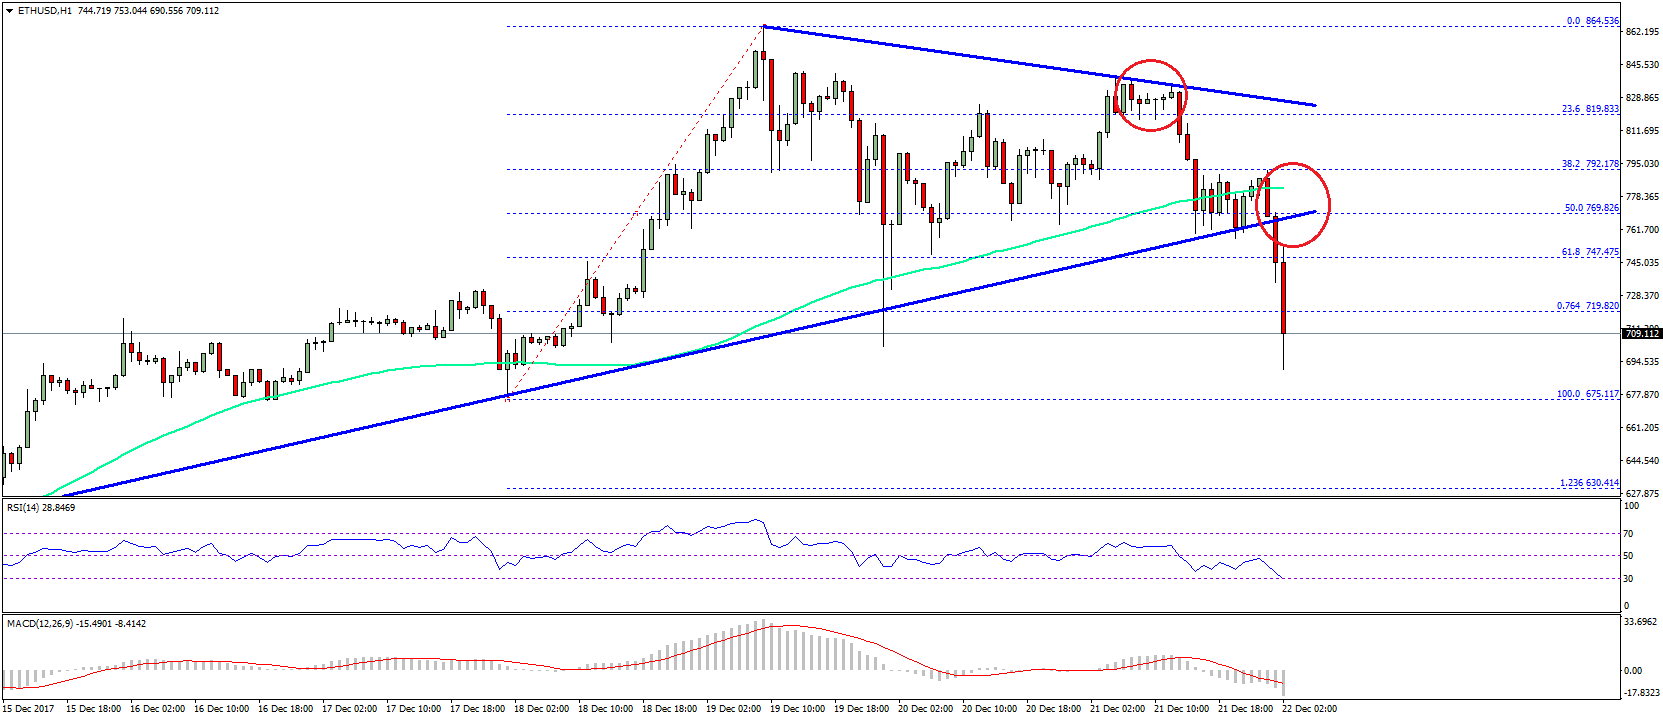
- Yesterday’s highlighted contracting triangle with support near $758 was broken on the hourly chart of ETH/USD (data feed via SimpleFX).
- The pair is now below the $720 level and is approaching the next major support at $700.
Ethereum price is extending correction against the US Dollar and Bitcoin. ETH/USD is approaching $700 and it might decline further.
Ethereum Price Decline
It seems like a major top has formed around the $860 level in ETH price against the US Dollar. The price was seen consolidating above the $800 and $760 support levels for some time. However, the price failed to hold gains and started a downside wave. During the downside, it broke the $800 and $760 support levels. There was also a break below the 50% Fib retracement level of the last wave from the $675.11 low to $864.53 high.
More importantly, yesterday’s highlighted contracting triangle with support near $758 was broken on the hourly chart of ETH/USD. The pair is now well below the $750 level and the 100 hourly simple moving average. These are negative signs and pointing toward more losses below $700 in the short term. At the moment, the pair is below the 76.4% Fib retracement level of the last wave from the $675.11 low to $864.53 high. Therefore, there are chances of more losses below $720 and $700.
On the upside, the broken support near $750 and $760 may act as a strong resistance. Moreover, the 100 hourly SMA is around $780 to prevent further upsides in the near term. On the downside, supports are present at $680 and $675.
Hourly MACD – The MACD is now gaining pace in the bearish zone.
Hourly RSI – The RSI is currently around the oversold levels, but with no sign of an upside move.
Major Support Level – $675
Major Resistance Level – $760
Charts courtesy – SimpleFX