Key Highlights
- ETH price traded further lower against the US Dollar to test $10.15 where it found support.
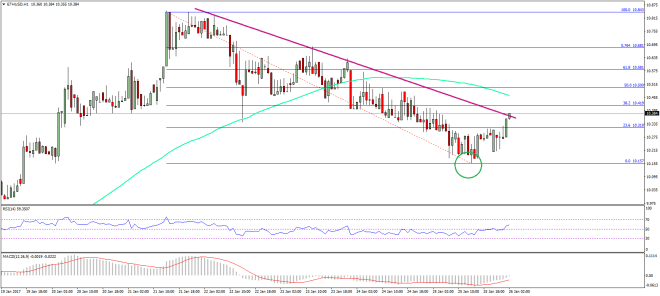
- The ETH/USD pair is now making an attempt to break yesterday’s highlighted bearish trend line on the hourly chart (data feed via SimpleFX).
- A break and close above $10.40 might open the doors for more gains in the near term.
Ethereum price found buyers near $10.15 against the US Dollar, and now it looks like ETH/USD is attempting an upside move.
Ethereum Price Recovery
We saw more declines in ETH price against the US Dollar, as it traded below $10.20 to trade as low as $10.15 where it found buyers. One important point to note is the fact that the price found support near a crucial level ($10.15). It represents the 50% Fib retracement level of the last leg higher from the $9.57 low to $10.84 high. So, we can say that the price may have completed a leg down, and might move higher towards $10.50.
The price already moved above the 23.6% Fib retracement level of the last decline from the $10.84 high to $10.15 low. So, there is a chance of more gains towards $10.50. At the moment, the ETH/USD pair is attempting to clear yesterday’s highlighted bearish trend line on the hourly chart (data feed via SimpleFX). If it succeeds in breaking the trend line resistance at $10.38 and closes above it, there are chances of more upsides.
The next hurdle could be around the 100 hourly simple moving average at $10.45. However, I think it won’t be easy for the ETH buyers to clear the resistance and move towards $10.50. So, I think we should wait for a proper break if planning to enter a buy trade.
Hourly MACD – The MACD is attempting to move into the bullish zone, which is a positive sign.
Hourly RSI – The RSI has moved above the 50 level, signaling a bullish bias.
Major Support Level – $10.20
Major Resistance Level – $10.40
Charts courtesy – SimpleFX


