Key Highlights
- ETH price continues to face resistance near the $11.20 level against the US Dollar.
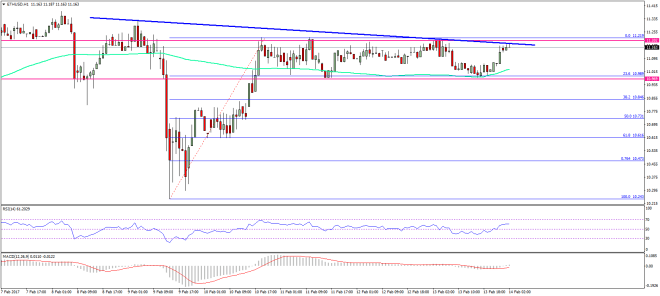
- It looks like there is a connecting bearish trend line formed on the hourly chart of ETH/USD (data feed via SimpleFX), acting as a resistance near $11.20.
- The pair may continue to trade in a range with support at $10.95 on the downside.
Ethereum price remained confined in a range against the US Dollar, and it looks like the ETH/USD pair is finding it tough to break $11.20.
Ethereum Price Resistance
There were only tiny range moves in ETH price against the US Dollar during the past 24 hours. The price failed to gain momentum, and stayed below the $11.20 resistance area. Yesterday, I highlighted how the stated level is acting as a resistance and preventing further gains towards $11.40. It continued to prevent upsides, and currently stopping an upside break.
At the moment, it looks like there is a connecting bearish trend line formed on the hourly chart of ETH/USD (data feed via SimpleFX). It is positioned near the $11.20 resistance and acting as a barrier for the ETH buyers. A break above it is needed if the price has to move further higher. The last few candles are positive, but the price remains capped. It looks like the ETH buyers are waiting for a catalyst for the next move.
On the downside, the range support is formed near $10.95-11.00. As mentioned yesterday, the 23.6% Fib retracement level of the last wave from the $10.24 low to $11.21 high is positioned near it. Moreover, the 100 hourly simple moving average is also aligned near $10.95. So, there is a good base formed near $11.00, which might continue to hold the downside if the price moves down.
Hourly MACD – The MACD is showing no major signs of a bullish break.
Hourly RSI – The RSI is above the 50 level, and remains supported.
Major Support Level – $11.00
Major Resistance Level – $11.20
Charts courtesy – SimpleFX


