Key Highlights
- ETH price after declining towards $280 found support and started an upside move against the US Dollar.
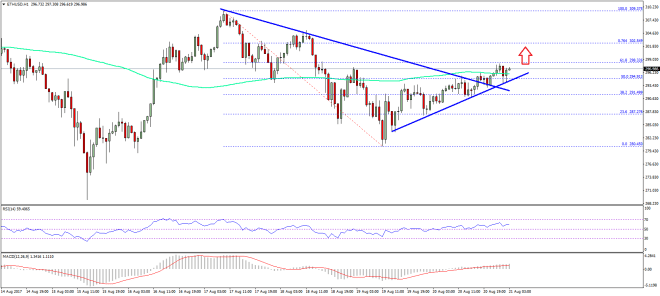
- There was a break above a connecting bearish trend line at $292 on the hourly chart of ETH/USD (data feed via SimpleFX).
- The pair is slowly moving higher and about to break the $300 resistance in the near term.
Ethereum price is gaining traction against the US Dollar and Bitcoin, but ETH/USD has to trade above $310 to move back in the bullish zone.
Ethereum Price Trend
There were only ranging moves recently in ETH price above the $280 level against the US Dollar. The price on the weekend traded lower and tested the $280 support zone where it found bids. Later, a recovery was initiated, and the price moved above the 23.6% Fib retracement level of the last decline from the $309.37 high to $280.45 low. It opened the doors for more gains and the price crawled above $290.
During the upside move, there was a break above a connecting bearish trend line at $292 on the hourly chart of ETH/USD. The price is now comfortably placed above the $292 level and the 100 hourly simple moving average. It is also above the 50% Fib retracement level of the last decline from the $309.37 high to $280.45 low, which is a bullish sign. Sooner or later, the price would move above $300 and attempt more gains in the near term.
On the downside, the $292 level and the 100 hourly simple moving average are support zones. If the price corrects lower, it may find support above $290. On the upside, today’s pivot stands at $302. Above $302, the price could head towards the $309 level.
Hourly MACD – The MACD is placed nicely in the bullish zone.
Hourly RSI – The RSI is moving higher and currently above the 50 level.
Major Support Level – $292
Major Resistance Level – $302
Charts courtesy – SimpleFX


