Key Highlights
- Its monstrous gains in ETH price, as it extended upside above $140 against the US Dollar, and may soon trade towards $160.
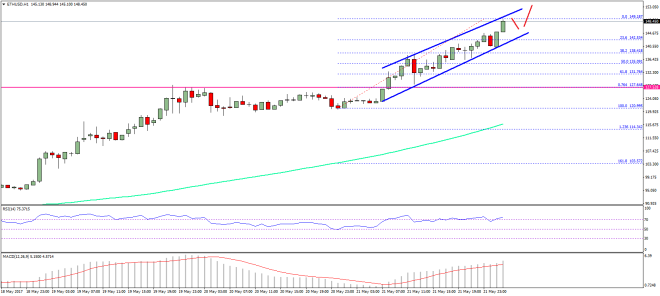
- There is a solid ascending channel pattern with support at $143 formed on the hourly chart (ETH/USD, data feed via SimpleFX).
- The price may dip a few points towards $144-145 before spiking above $150-152 in the near term.
Ethereum price is putting the best show against the US Dollar and Bitcoin, and ETH/USD may now soon head higher above $150 towards $160 or even $175.
Ethereum Price Bullish Trend
Yesterday, I mentioned that if ETH buyers remain in action, it can soon move above $130 to test $135-138 against the US Dollar. It did move higher, and not only broke $138, but also managed to surge above $145. The current trend is super bullish and pointing further gains above $150. The price may soon break and settle above $150 for a sustained upside move towards $160.
At the moment, the price is trading just below $150, and may soon break it. There is a solid ascending channel pattern with support at $143 formed on the hourly chart of ETH/USD. If the pair dips a few points from the current levels, it may find support near $144-145. The 23.6% Fib retracement level of the last wave from the $120.99 low to $149.18 high is at $142.52. So, the channel support at $143 may play a major role.
There is a high possibility of a reaction near $150. So, we may see a dip of around $8-10 going forward. However, the larger trend remains bullish with chances of nasty spikes towards $160 or even $175. Below $142, the $135 support may come into the picture.
Hourly MACD – The MACD is placed with a lot of momentum in the bullish zone.
Hourly RSI – The RSI is floating in the overbought levels.
Major Support Level – $142.00
Major Resistance Level – $150.00
Charts courtesy – SimpleFX


