Key Highlights
- ETH price made a downside move and broke a short-term support area at $12.40 against the US Dollar.
- The range support trend line at $12.54 was also broken on the hourly chart of ETH/USD (data feed via SimpleFX).
- The pair traded as low as $12.07 where it found support and recovered sharply.
Ethereum price made a downside move below $12.40 against the US Dollar, but later the ETH/USD pair managed to recover from $12.10.
Ethereum Price Downside Move
There was an ongoing range pattern noticed with support at $12.40 in ETH price against the US Dollar. The price later failed to gain momentum, and moved down to break the $12.40 support area. There was a clear break of the range support trend line at $12.54 on the hourly chart of ETH/USD (data feed via SimpleFX). It opened the doors for more downsides, and pushed the price lower towards the $12.10 level.
Later, the price found support after trading as low as $12.07, and started recovering. It moved above the 23.6% Fib retracement level of the last decline from the $13.24 high to $12.07 low. The recovery was nice, but there is a concern. The broken support area at $12.40-12.50 is now acting as a resistance zone. It is preventing gains and might push the price back lower.
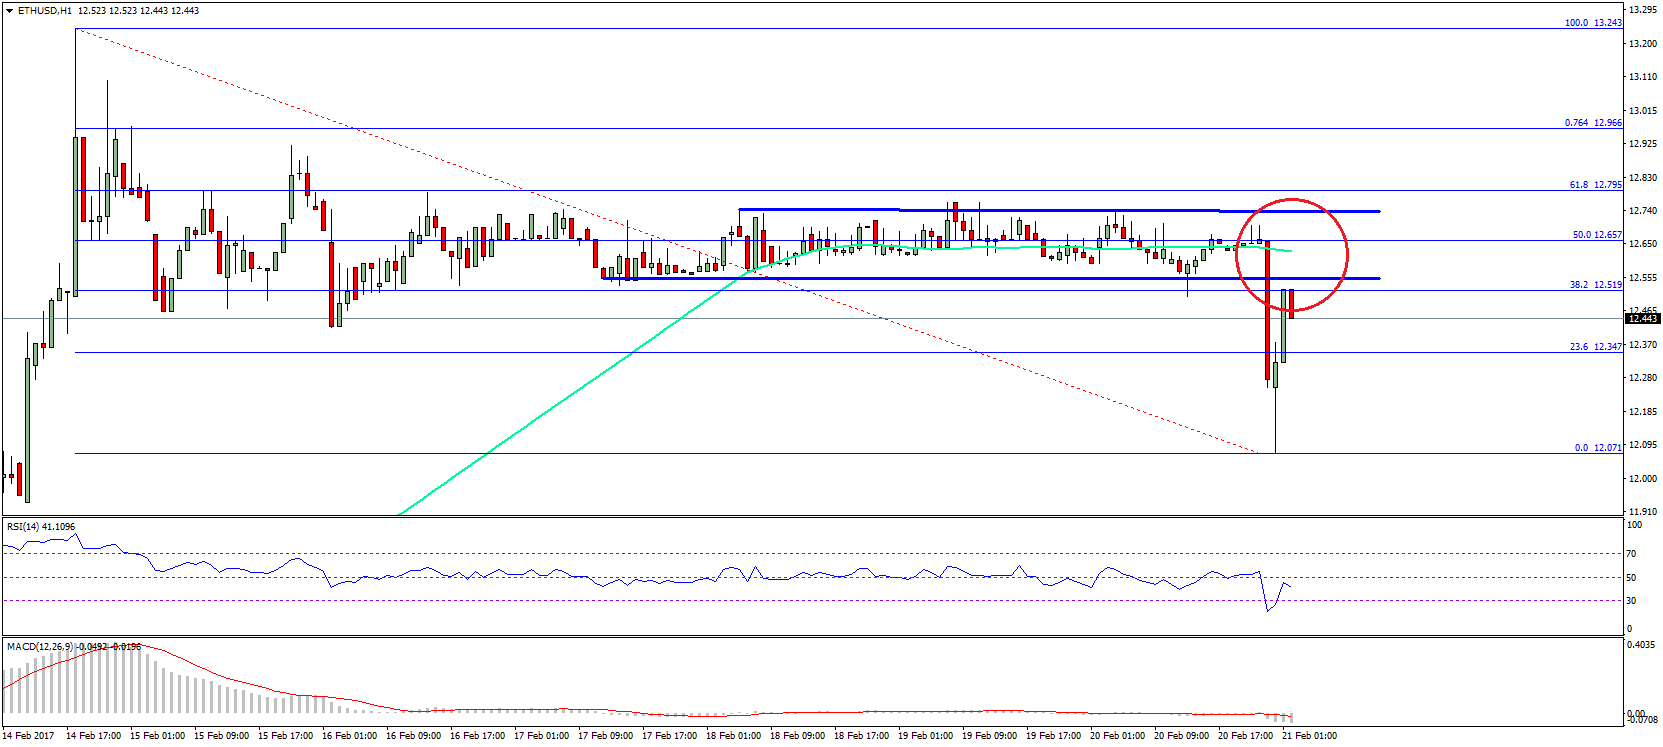
Moreover, the 38.2% Fib retracement level of the last decline from the $13.24 high to $12.07 low at $12.51 is also acting as a resistance. In short, it looks like the price broke a crucial support area, and if it stays below it, there can be more declines. On downside, the $12.10-12.00 support area may act as a pivot area.
Hourly MACD – The MACD has moved into the bearish zone, breaking flat bias.
Hourly RSI – The RSI moved down, and now below the 50 level to signal downsides.
Major Support Level – $12.10
Major Resistance Level – $12.50
Charts courtesy – SimpleFX