Key Highlights
- ETH price after trading as low as $286.13 against the US Dollar started a short-term correction.
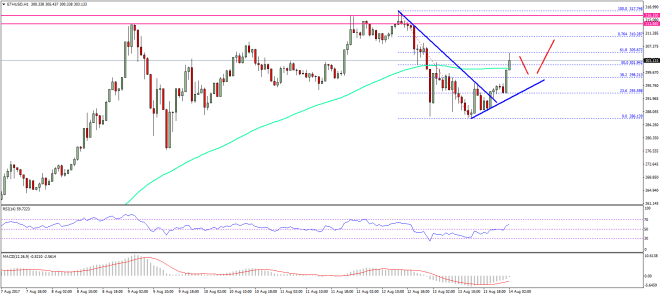
- There was a break above a steep bearish trend line with resistance at $293.50 on the hourly chart of ETH/USD (data feed via SimpleFX).
- The pair might continue to move higher and could even test a major hurdle near $313-316.
Ethereum price is recovering against the US Dollar and Bitcoin, and ETH/USD might soon head higher towards the previous swing high near $315.
Ethereum Price Resistance
This past week during the end, we saw a decline in ETH price below the $300 handle against the US Dollar. The price traded below the $290 level and traded as low as $286.13 where it found support. Later, after a minor consolidation, a recovery above $290 started. The price moved above the 23.6% Fib retracement level of the last decline from the $317.74 high to $286.13 low.
There was also a break above a steep bearish trend line with resistance at $293.50 on the hourly chart of ETH/USD. The mentioned trend line break above $295 has cleared the path for more gains. The price even traded above the 100 hourly simple moving average and $300. At the moment, it is facing sellers near the 61.8% Fib retracement level of the last decline from the $317.74 high to $286.13 low. There is a chance of a minor pullback towards the 100 hourly SMA or $298.
On the upside, there are chances of ETH price testing the last swing area of $315. There are two important resistances at $313 and $316. So, it would be interesting to see whether sellers are able to protect gains above $316 in the near term.
Hourly MACD – The MACD is about to move from the bearish to bullish zone.
Hourly RSI – The RSI has moved above the 50 level.
Major Support Level – $298
Major Resistance Level – $316
Charts courtesy – SimpleFX


