Key Highlights
- ETH price fell sharply intraday and traded towards the $270 level against the US Dollar.
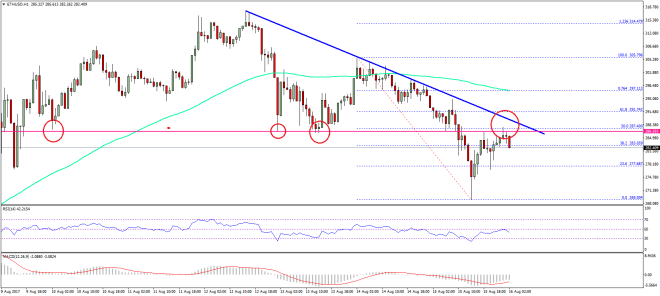
- Yesterday’s highlighted connecting bearish trend line with current resistance at $287.00 on the hourly chart of ETH/USD (data feed via SimpleFX) is a major hurdle.
- The pair might resume its decline and could even retest the last swing low of $269.
Ethereum price declined sharply against the US Dollar and Bitcoin, and now it seems like a recovery in ETH/USD above $300 won’t be easy.
Ethereum Price Resistance
There was an increase in selling pressure on ETH price, taking it below the $280 level against the US Dollar. The price attempted a move above the $308 level and the 100 hourly simple moving average. However, it failed to settle above $308 and started a downside move. Later, sellers gained pace and the price declined below a key support area of $287. It opened the doors for more losses and the price moved below $280.
There was a new weekly low formed at $269.00 from where a minor recovery is initiated. The price moved above the 38.2% Fib retracement level of the last decline from the $305.79 high to $269.00 low. However, it failed to move above $287. The broken support at $287 is acting as a resistance. Moreover, the 50% Fib retracement level of the last decline from the $305.79 high to $269.00 low is also near $287. Lastly, yesterday’s highlighted connecting bearish trend line with current resistance at $287.00 on the hourly chart of ETH/USD is also a crucial hurdle.
Overall, it seems like the $287-290 zone is a major resistance zone for ETH. The price may soon resume its downside move and trade back towards the $270 level.
Hourly MACD – The MACD is reducing its bearish slope, but still in the negative zone.
Hourly RSI – The RSI is struggling to move back above the 50 level.
Major Support Level – $270
Major Resistance Level – $287
Charts courtesy – SimpleFX


