Key Highlights
- ETH price recoveries are capped by the $312-314 resistance zone against the US Dollar.
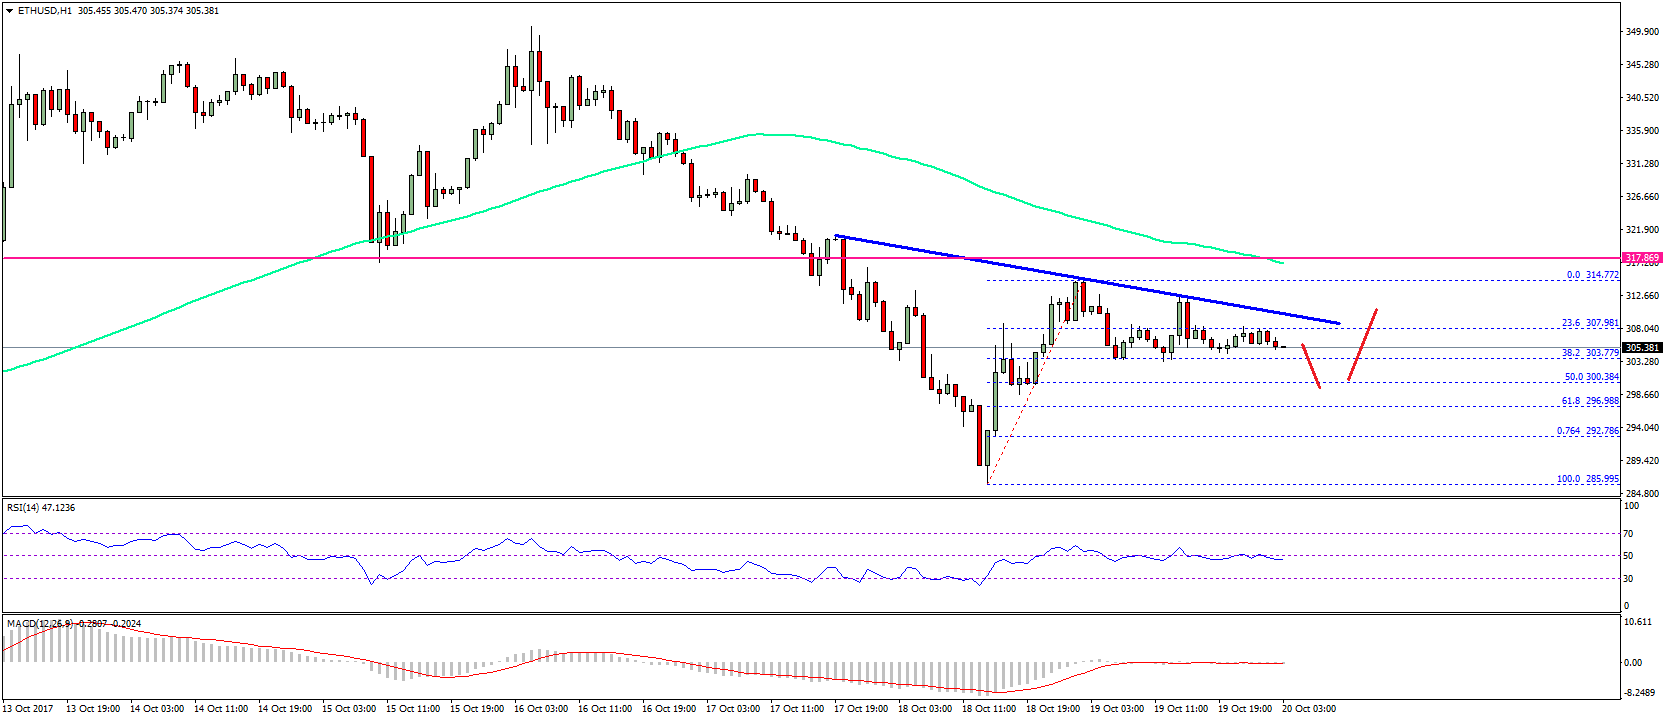
- There is a new connecting bearish trend line forming with resistance near $308 on the hourly chart of ETH/USD (data feed via SimpleFX).
- The price might extend the recent slide and likely to test the $300-301 support area.
Ethereum price is currently moving down against the US Dollar and Bitcoin. ETH/USD might retest $300-301 before attempting an upside move.
Ethereum Price Downside Move
There was a slight recovery in ETH price yesterday towards the $314 level against the US Dollar. The price failed to gain traction above $310 and started a downside move. It traded below the 23.6% Fib retracement level of the last wave from the $285.99 low to $314.77 high. However, the downside move seems to be limited considering the current bias below $314.
Buyers appeared around the 38.2% Fib retracement level of the last wave from the $285.99 low to $314.77 high and protected declines. On the upside, there is a new connecting bearish trend line forming with resistance near $308 on the hourly chart of ETH/USD. A break above the trend line resistance and the $314 high won’t be easy. There is a chance that the pair might dip towards the 50% Fib retracement level of the last wave from the $285.99 low to $314.77 high at $300.38.
The $300-301 support area holds the key for the current slide in ETH. As long as the price is above the $300 level, it should break the trend line for an upside move. The $314 resistance is now significant since it is positioned with the 100 hourly simple moving average.
Hourly MACD – The MACD is almost flat and pointing towards range moves in the bearish zone.
Hourly RSI – The RSI is currently just below the 50 level and showing neutral signs.
Major Support Level – $300
Major Resistance Level – $314
Charts courtesy – SimpleFX