Reason to trust

How Our News is Made
Strict editorial policy that focuses on accuracy, relevance, and impartiality
Ad discliamer
Morbi pretium leo et nisl aliquam mollis. Quisque arcu lorem, ultricies quis pellentesque nec, ullamcorper eu odio.
Key Highlights
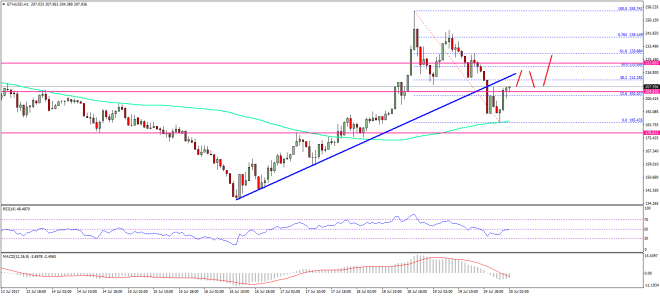
- ETH price started a correction after trading as high as $255.74 against the US Dollar.
- Yesterday’s highlighted major bullish trend line with support at $205 on the hourly chart of ETH/USD (data feed via SimpleFX) was broken.
- The price is bouncing back, and it looks like a correction towards $185 is now complete.
Ethereum price likely completed a short-term correction against the US Dollar and Bitcoin. Now, ETH/USD is about to resume its bullish trend.
Ethereum Price Upside Move
Yesterday, we saw a rally in ETH price above the $250 level against the US Dollar. The price traded as high as $255.74 before starting a correction. During the correction wave, the price was able to break the 50% Fib retracement level of the last wave from the $136.50 low to $255.74 high. Also during the downside move, there was a break below yesterday’s highlighted major bullish trend line with support at $205 on the hourly chart of ETH/USD.
The pair traded towards the 100 hourly simple moving average at $185 where it found support. The stated level was also above the 61.8% Fib retracement level of the last wave from the $136.50 low to $255.74 high. The price is now recovering well, and it looks like a correction towards $185 is now complete. A move above the 23.6% Fib retracement level of the last decline from the $255.74 high to $185.43 low is a positive sign.
The price now needs to settle above the $200 level. Once it does, it can easily break $215 and the 38.2% Fib retracement level of the last decline from the $255.74 high to $185.43 low. Buying dips close to the 100 SMA or $190 may be considered in the short term.
Hourly MACD – The MACD is about to move back in the bullish zone.
Hourly RSI – The RSI is higher towards the 50 level.
Major Support Level – $190
Major Resistance Level – $215
Charts courtesy – SimpleFX


