Key Highlights
- ETH price started a short-term correction after trading as high as $313.05 against the US Dollar.
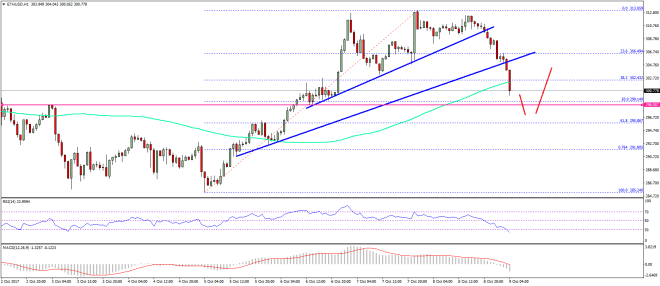
- There was a break below two bullish trend lines with support at $310 and $305 on the hourly chart of ETH/USD (data feed via SimpleFX).
- The price is now trading close to the 100 hourly simple moving average and remains supported above $298.50.
Ethereum price is correcting lower against the US Dollar and Bitcoin. ETH/USD is approaching a major support area near $298 where buyers would emerge.
Ethereum Price Support
There were decent gains in ETH price above the $300 level against the US Dollar. The price traded above the $310 level and formed a high at $313.05. Later, a correction wave was initiated and the price moved below the 23.6% Fib retracement level of the last leg from the $285.20 low to $313.05 high. However, the recent wave got extended as the price moved below the $306 level.
At the moment, the price is trading below the 38.2% Fib retracement level of the last leg from the $285.20 low to $313.05 high. Sellers succeeded in breaking two bullish trend lines with support at $310 and $305 on the hourly chart of ETH/USD. It seems like the price might correct further and could even test the $298-299 support area. The 50% Fib retracement level of the last leg from the $285.20 low to $313.05 high is also near $299.14.
At present, the pair is trading near the 100 hourly simple moving average and struggling to remain above $301. There is a chance of a dip towards $298-296 where buyers should protect more declines. Any further declines would be a bearish sign for a move towards the next important support at $291.
Hourly MACD – The MACD has moved back in the bearish zone.
Hourly RSI – The RSI is reaching the oversold levels.
Major Support Level – $298
Major Resistance Level – $306
Charts courtesy – SimpleFX


