Key Highlights
- ETH price failed to hold the minor corrective trend yesterday against the US Dollar and moved down.
- Yesterday’s highlighted tiny bullish trend line on the hourly chart (data feed via SimpleFX) of ETH/USD was broken at $7.58 to initiate a downtrend.
- The pair is currently under a bearish pressure, and may soon head lower towards $7.35.
Ethereum price yesterday’s recovery attempt failed against the US Dollar and BTC. Going forward, ETH/USD may decline further towards $7.35.
Ethereum Price Decline
There was a minor correction yesterday in ETH price versus the US Dollar. However, the upside wave in ETH/USD could not last long, as the price failed to clear the 38.2% Fib retracement level of the last decline from the $8.33 high to $7.34 low. Moreover, the 100 hourly simple moving average continued to act as a resistance and pushed the price down.
During the downside move, the price closed below yesterday’s highlighted tiny bullish trend line on the hourly chart (data feed via SimpleFX) of ETH/USD at $7.58. There was no help for the ETH buyers, as the price moved below the 50% Fib retracement level of the last wave from the $7.34 low to $7.82 high. So, there is a high risk that the pair may test the full 100% swing low in the near term.
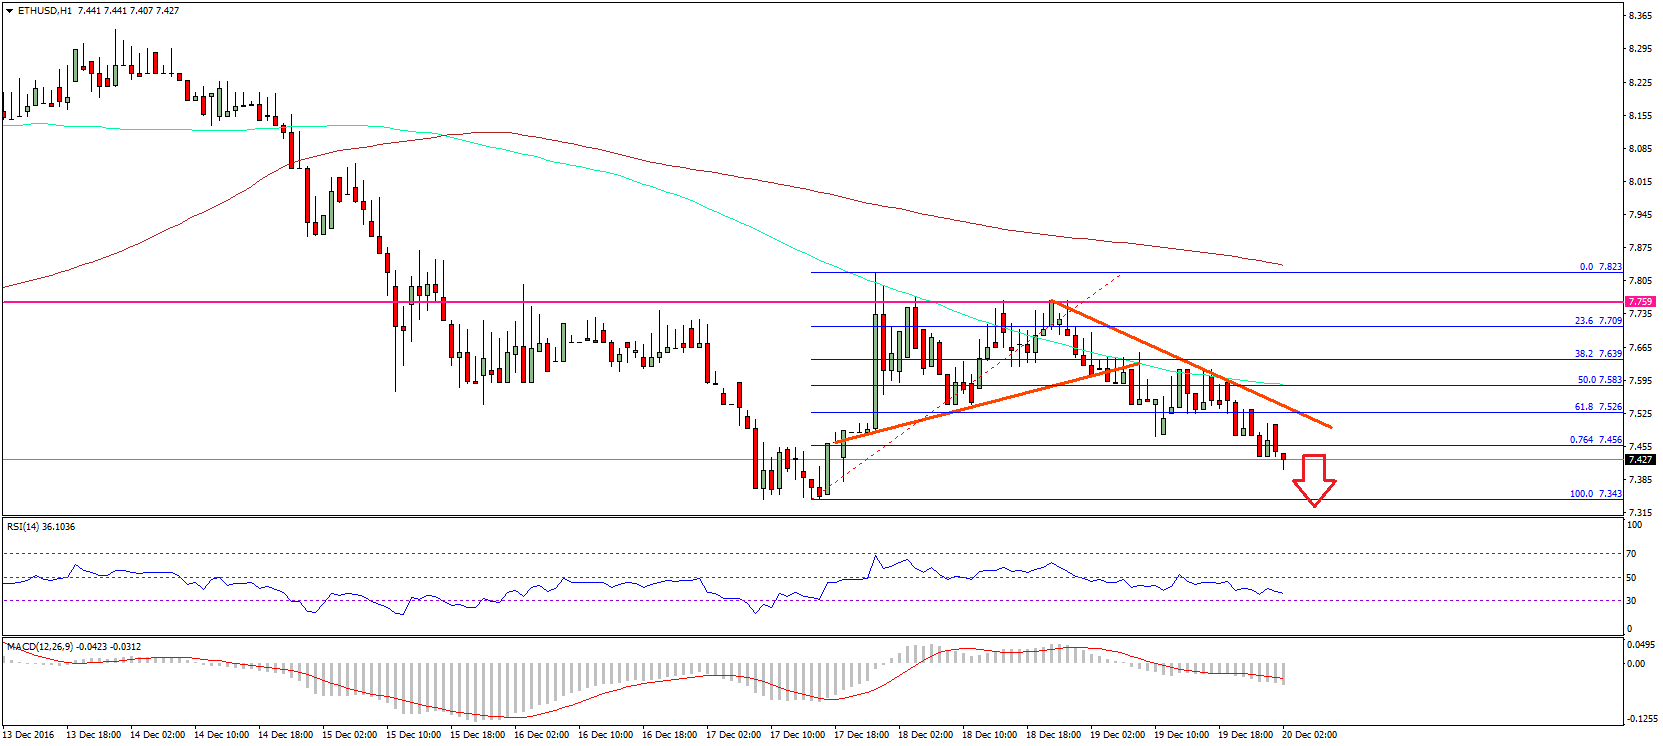
On the upside, there is a bearish trend line formed on the same chart, which is currently acting as a resistance along with the 100 hourly SMA at $7.50. So, if the pair attempts to correct higher, it may face sellers near $7.50. A break above it could push the price back towards the all-important $7.85 resistance. However, the chances of a decline towards $7.35 at the moment are very high.
Hourly MACD – The MACD has moved into the bearish zone.
Hourly RSI – The RSI is heading lower, and currently well below the 50 level.
Major Support Level – $7.35
Major Resistance Level – $7.50
Charts courtesy – SimpleFX