Key Highlights
- ETH price was well bid during the past two sessions against the US Dollar, and remained above $10.15.
- Yesterday’s highlighted connecting bullish trend line on the hourly chart (data feed via SimpleFX) of ETH/USD is still active and acting as a support near $10.05.
- There is another bullish trend line formed on the same chart, acting as a support at the moment near $10.35.
Ethereum price is trading above a couple of bullish trend lines on the hourly chart. So, ETH/USD may continue to slowly move higher.
Ethereum Price Slow Trend
There were positive swing moves noted in ETH price against the US Dollar during the past two sessions, as it remained above a few key support levels. The most important point was that it held yesterday’s highlighted connecting bullish trend line on the hourly chart (data feed via SimpleFX) of ETH/USD. There was a minor dip towards the $10.00 support area where the trend line came in and acted as a support.
During the dip, the price broke the 38.2% Fib retracement level of the last wave from the $9.40 low to $10.66 high. However, as mentioned the trend line provided support. Furthermore, the 50% Fib retracement level of the last wave from the $9.40 low to $10.66 high also acted as a support. The price is now moving back higher and currently positioned above the $10.30 level.
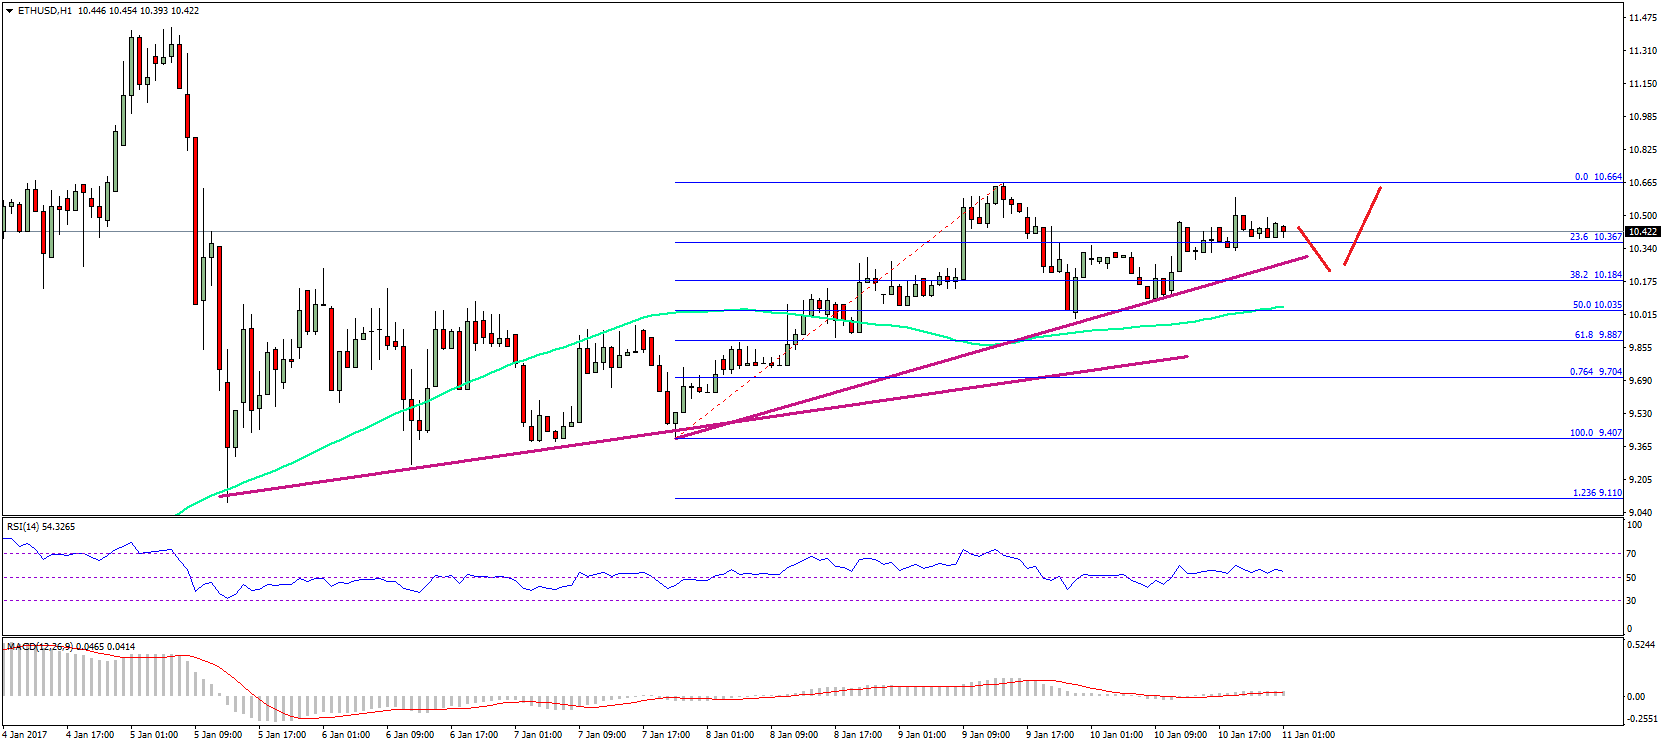
On the downside, there is another bullish trend line formed on the same chart. It is providing support at the moment near $10.35, and containing a downside move. As long as the price is above $10.10, it looks like in a slow and steady uptrend.
Hourly MACD – The MACD is in the bullish zone, but there is hardly any momentum.
Hourly RSI – The RSI is currently above the 50 level with no real upside move.
Major Support Level – $10.10
Major Resistance Level – $10.65
Charts courtesy – SimpleFX