Key Highlights
- ETH price continued its surge and moved past the $15.80 resistance against the US Dollar.
- A crucial resistance trend line at $16.32 on the hourly chart of ETH/USD (data feed via SimpleFX) was broken to ignite further gains.
- The current trend is super bullish, and the price may look to extend gains with support at $16.70.
Ethereum price rocketed above the $17.00 handle against the US Dollar, and it looks the ETH/USD is strongly bullish and remains buy on dips.
Ethereum Price Buy Zone?
Our idea of buying dips in ETH price worked again vs the US Dollar, as after a dip towards $15.30 the price moved higher. The price surged higher, and managed to break a monster resistance area at $15.80. It was a good opening for the bulls, as the price moved past the $17.00 handle as well. The most important point was that a major connecting bullish trend line at $16.10 is intact.
During the upside, there was a break above a crucial resistance trend line at $16.32 on the hourly chart of ETH/USD (data feed via SimpleFX). It is a clear sign that the price may continue to rise and might soon break the recent high of $17.36 for further gains. The next stop on the upside could be near $17.88. On the downside, an initial support and buy zone is at 23.6% Fib retracement level of the last wave from the $14.64 low to $17.36 high.
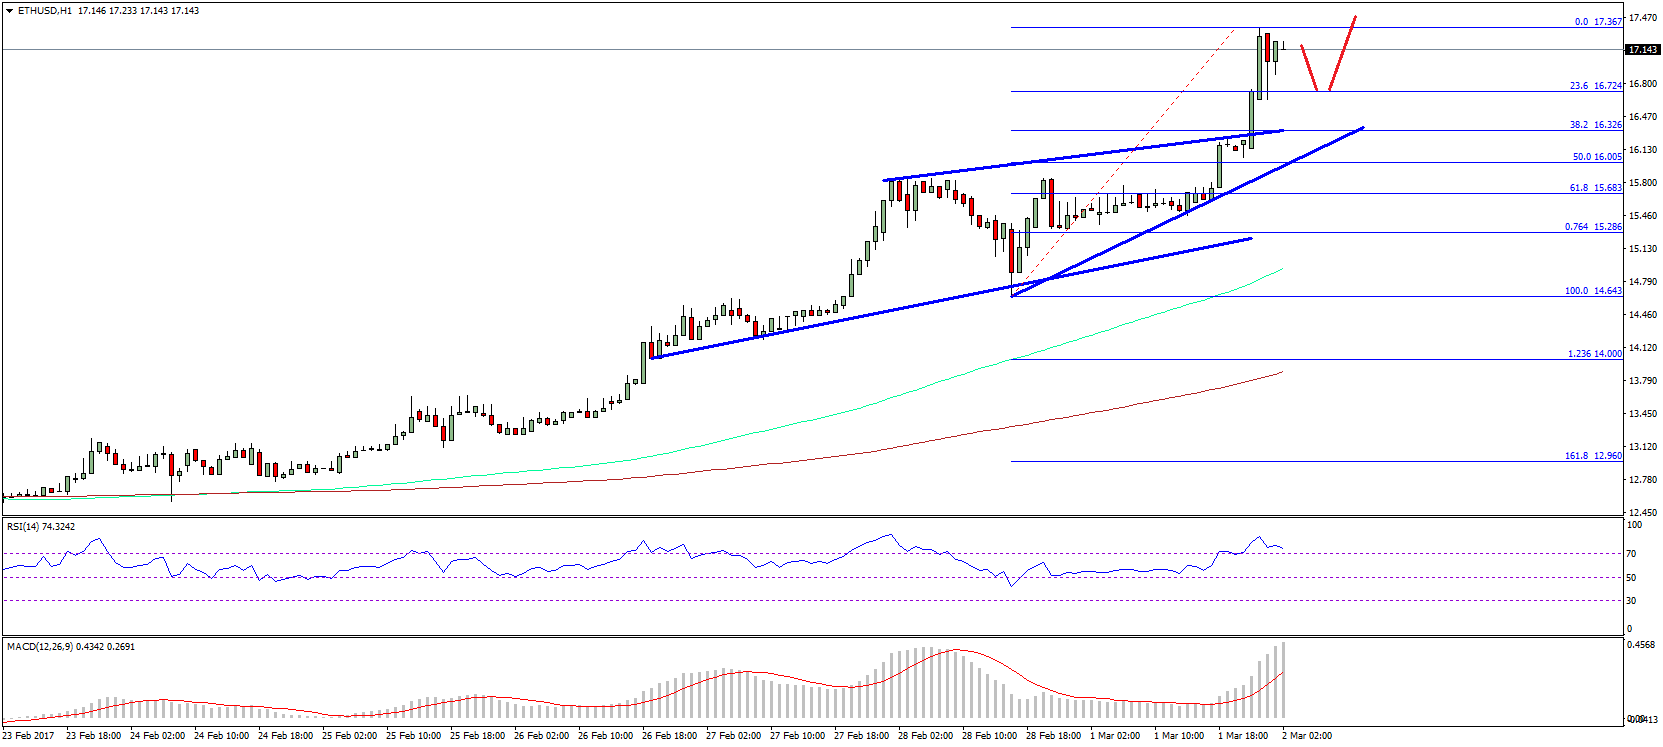
However, the most important support is near the broken resistance trend line at $16.32. It also coincides with the 38.2% Fib retracement level of the last wave from the $14.64 low to $17.36 high. So, one may consider buying with a stop below $16.00.
Hourly MACD – The MACD is super bullish, calling for more gains.
Hourly RSI – The RSI is well into the overbought levels.
Major Support Level – $16.70
Major Resistance Level – $17.40
Charts courtesy – SimpleFX