

Ethereum Price Key Highlights
- Upon breaking below the bottom of the rising wedge consolidation pattern recently, ethereum price has its sights set on new lows.
- Technical indicators suggest that the selloff is gaining traction but that a pullback to the broken support zones might still be possible.
Ethereum price is eyeing further downside and might be ready to test the yearly lows as seen on the 4-hour time frame.
Bearish Pressure Rising
Bitcoin price has broken to the upside of its consolidation pattern, which may have been partly to blame for the downside break in ETHXBT. The chart pattern spans roughly 0.00100 points so the resulting breakdown could last by the same amount, taking ethereum price down to 0.00200 or much lower.
The 100 SMA is still above the longer-term 200 SMA for now but the short-term moving average is edging closer to a possible downward crossover. If that happens, it could draw more sellers to the mix and add more bearish pressure for ethereum price.
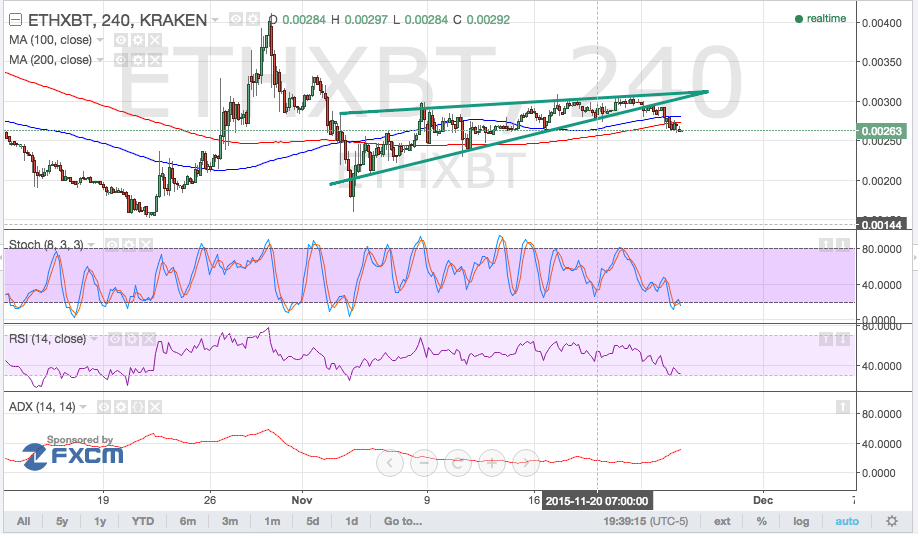

Stochastic is already indicating oversold conditions so a quick bounce could take place sooner or later. In that case, price could pull back to the broken wedge support just below the 0.00300 handle. RSI is still on the move down, revealing that sellers are still mostly in control.
Meanwhile, the average directional index is starting to turn higher, potentially indicating a return to trending market conditions once it moves past the 50.0 level. A strong selloff could lead to a drop to the yearly lows at 0.00150 for ethereum price or much lower.
However, if the downside break proves to be a false one and ethereum price regains ground back inside the rising wedge, buyers could make another attempt at an upside break and resulting rally. In that case, price could move up to the previous highs at 0.00400.
Charts from Kraken, courtesy of TradingView