Key Highlights
- ETH price failed once again to clear a major resistance area against the US Dollar, and was seen trading in a range.
- I highlighted a bearish trend line on the hourly chart (data feed via SimpleFX) of ETH/USD this week, which is still acting as a monstrous resistance for ETH.
- The price attempted at least 10 times to break it, but failed to gain traction.
Ethereum price ETH struggle to clear a monster resistance trend line continues. The buyers have to clear it in order to take the price higher.
Ethereum Price Range
Ethereum price ETH attempted to clear a bearish trend line on the hourly chart (data feed via SimpleFX) of ETH/USD yesterday, but failed. I have been tracking the highlighted trend line for a few days, and stated yesterday that it holds the key in the short term. The price continued its struggle to break it and trade above it, which is not a good sign for the bulls.
During the past 10 hours, there were at least 6 attempts to break the highlighted bearish trend line. It clearly shows the price is lagging momentum to move higher, which may result in a downside move. The price is currently ranging around the 23.6% Fib retracement level of the last drop from the $12.03 high to $10.59 low with very low trading volume. So, there can be a flush in the short term before there can be an upside move.
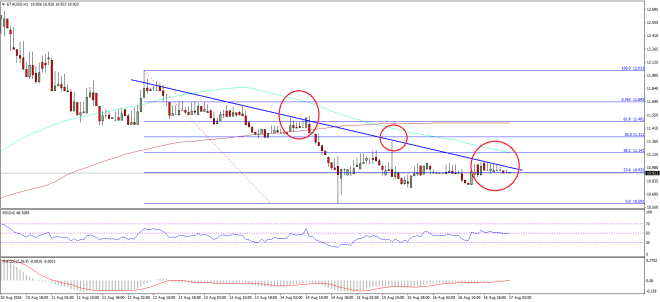

The ETH/USD pair may trade higher only if there is a break above the highlighted bearish trend line. In my view, there can be a move below $10.80-50 level before the ETH bulls step in.
Hourly MACD – The MACD is almost flat, but showing signs of changing bias in the short term.
Hourly RSI – The RSI just curved away from the 50 level, and failed to break the stated level.
Major Support Level – $10.80
Major Resistance Level – $11.00
Charts courtesy – SimpleFX