
Reason to trust
How Our News is Made
Strict editorial policy that focuses on accuracy, relevance, and impartiality
Ad discliamer
Morbi pretium leo et nisl aliquam mollis. Quisque arcu lorem, ultricies quis pellentesque nec, ullamcorper eu odio.
Key Highlights
- Ethereum price finally showed some signs of life, as it traded above a major resistance against the US Dollar.
- Yesterday’s highlighted bearish trend line on the hourly chart (data feed via Kraken) of ETH/USD was cleared to ignite an upside move.
- The price is now above the 100 hourly simple moving average, which is a positive sign for the bulls.
Ethereum price spiked higher against the US Dollar, and the last few hourly candles look very positive for more gains in the short term.
Ethereum Price Break
There was a nice upside move in Ethereum price ETH against the US Dollar, which took it above a couple of important resistance levels. The ETH/USD pair even traded above the $10.60 level. However, the most important point to note is that the pair broke yesterday’s highlighted bearish trend line on the hourly chart (data feed via Kraken), signaling more gains.
The current price action is very positive, as the price is now trading above the 100 hourly simple moving average. At this moment, the bears are defending the 61.8% Fib retracement level of the last drop from the $11.30 high to $10.08 low.
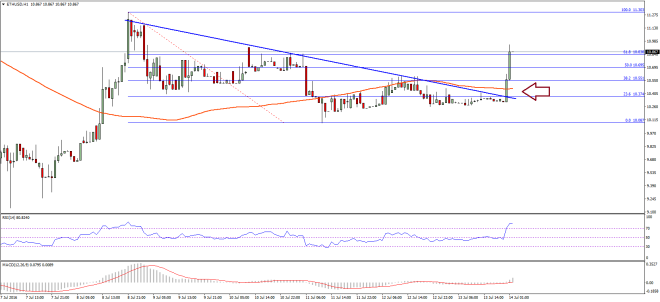
So, there is a chance of a minor correction in the near term in ETH/USD, which could find support around the 100 hourly SMA and the broken trend line. On the upside, a break and close above the mentioned fib level could take the price towards the last swing high of $11.30. I think one may consider buying dips as long as the price is above the 100 hourly SMA or above the $10.30 level.
Hourly MACD – The MACD has moved into the bullish zone, which is a call for more upsides in the short term.
Hourly RSI – The RSI jumped sharply towards the 80 level, and currently correcting lower to signal a minor correction.
Major Support Level – $10.50
Major Resistance Level – $11.00
Charts courtesy – SimpleFX


