Key Highlights
- Ethereum price after moving down against the US Dollar found support and traded higher.
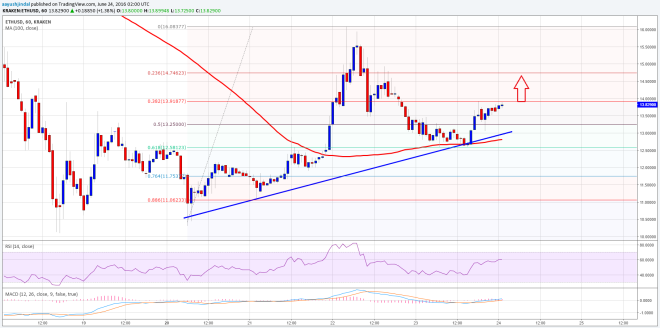
- Yesterday’s highlighted bullish trend line on the hourly chart (data feed via Kraken) of ETH/USD acted as a perfect support area.
- The price also got bids near the 100 hourly simple moving average and currently trading above the $13.50 level.
Ethereum price once again started to move higher, as the trend line support acted as a barrier for the ETH sellers and prevented the downside move.
Ethereum Price Buy
Ethereum price ETH after correcting lower against the US Dollar found buyers one more time, and started to move higher. There was a nice reaction around yesterday’s highlighted bullish trend line on the hourly chart (data feed via Kraken) of ETH/USD, which acted as a perfect barrier for losses.
Moreover, the 61.8% Fib retracement level of the last leg from the $10.37 low to $16.08 high also acted as a support area along with the 100 hourly simple moving average, and pushed the price higher. Currently, the price is trading near an intermediate resistance area of $13.90-$14.00, which is preventing further gains in the short term.

I think the price may dip one more time to retest the trend line and support area of the 100 hourly SMA. In that situation, we can consider a short-term buy trade. However, the stop should be placed below the 100 hourly SMA, as a break below it may call for more losses in the near term. On the downside, the $13.00 level can be considered as a support area for ETH vs USD.
Hourly MACD – The MACD is in the bullish area, but not showing enough signs of more gains from the current levels.
Hourly RSI – The RSI is above the 50 level, which is a positive sign for the bulls.
Major Support Level – $13.00
Major Resistance Level – $14.00
Charts courtesy of Kraken via Trading View


