Reason to trust

How Our News is Made
Strict editorial policy that focuses on accuracy, relevance, and impartiality
Ad discliamer
Morbi pretium leo et nisl aliquam mollis. Quisque arcu lorem, ultricies quis pellentesque nec, ullamcorper eu odio.
Key Highlights
- Ethereum price somehow managed to recover a few points yesterday against the US dollar.
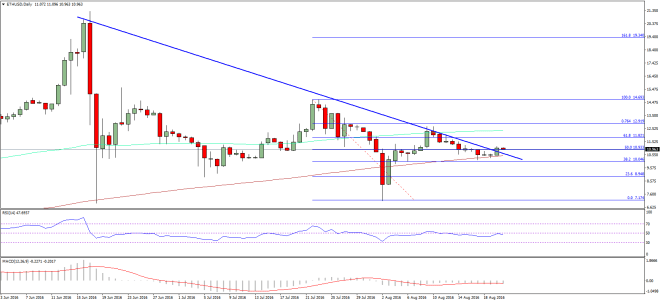
- There was a major bearish trend line formed on the daily chart of the ETH/USD pair (data feed via SimpleFX), which looks like broken during the recent move.
- If the current break is true, then the ETH/USD pair may head further higher.
Ethereum price recently corrected higher versus the US Dollar, but we need to see if the current pace can be retained by buyers or not.
Ethereum Price Upside Move
Ethereum price ETH remained in a heavy downtrend during this past week against the US Dollar, and traded as low as $10.17. However, the ETH bulls finally managed to defend further downsides, and pushed the price higher. There was a major bearish trend line on the daily chart of the ETH/USD pair (data feed via SimpleFX). It looks like buyers have managed to push the price above the highlighted trend line. If the recent trend line break is true, then there is a chance of more gains in ETH.

The price is currently trading near the 50% Fib retracement level of the last drop from the $14.69 high to $7.17 low. So, it may not be easy for buyers to push the price further higher. However, if they succeed, then a test of the 100-day simple moving average on the upside is also possible. Furthermore, the 61.8% Fib retracement level of the last drop from the $14.69 high to $7.17 low is also positioned just below it.
In my opinion, the ETH/USD pair is showing a few positive just, and now it all depends on buyers to maintain momentum.
Daily MACD – The MACD is still in the bearish zone, but may move into the bullish slope.
Daily RSI – The RSI is just below the 50 level, and a break is needed for further push.
Major Support Level – $10.50
Major Resistance Level – $11.20
Charts courtesy – SimpleFX


